Exploring the value of situating K-12 learning in real-world places, problems, and processes
Author: Paula Waatainen
Paula Waatainen (EdD) teaches Social Studies Methods in the Faculty of Education at Vancouver Island University. She completed her doctoral work in the Learning Sciences at the University of Calgary and is a former high school social studies teachers. Paula loves to connect learning to place and to real-world issues.
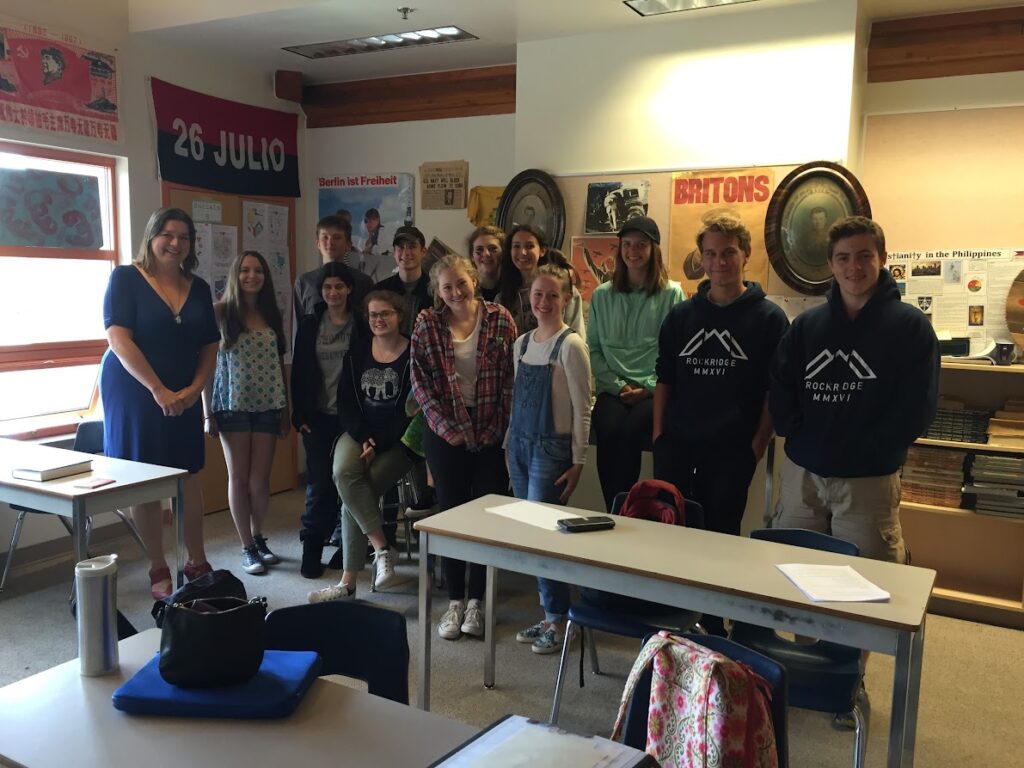
With 2016 Rockridge grads, seeing me off on my last day of high school teaching.
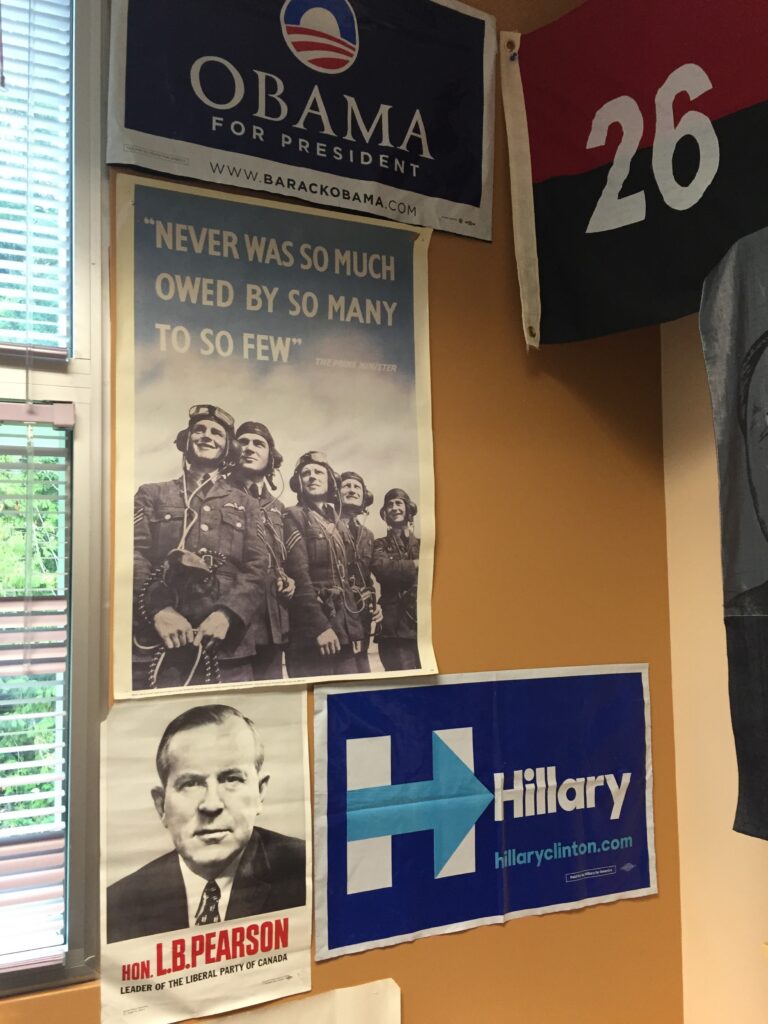
The end of this school year marks ten years since I handed in the keys to my classroom at Rockridge Secondary school, and picked up the key to my new shared office in the Faculty of Education at VIU. I taught in West Vancouver schools for 21 years, building a rich collection of memories, relationships, resources, and political history mementos for my walls. Some of these mementos stayed behind in my former colleagues’ classrooms, but I put these ones up the first day in my new office.
Ten yearsago…
In 2016, Justin Trudeau was still the new prime minister and Barack Obama was still the American president. AI and global pandemics seemed the stuff of science fiction to most of us, and we had likely never heard of a heat dome.
In 2016, the “revised BC curriculum” was in its first year of implementation at K-9, and those of us who were writing the 10-12 courses were still finalizing their development.
In May, 2016, the Ministry of Education announced that the provincial exam program had ended, and would be replaced with graduation literacy and numeracy assessments that would neither be tied to specific courses nor “count” toward student grades. The province began to pilot a new 4-point proficiency scale in a limited number of school districts, including Nanaimo-Ladysmith, where my family lives.
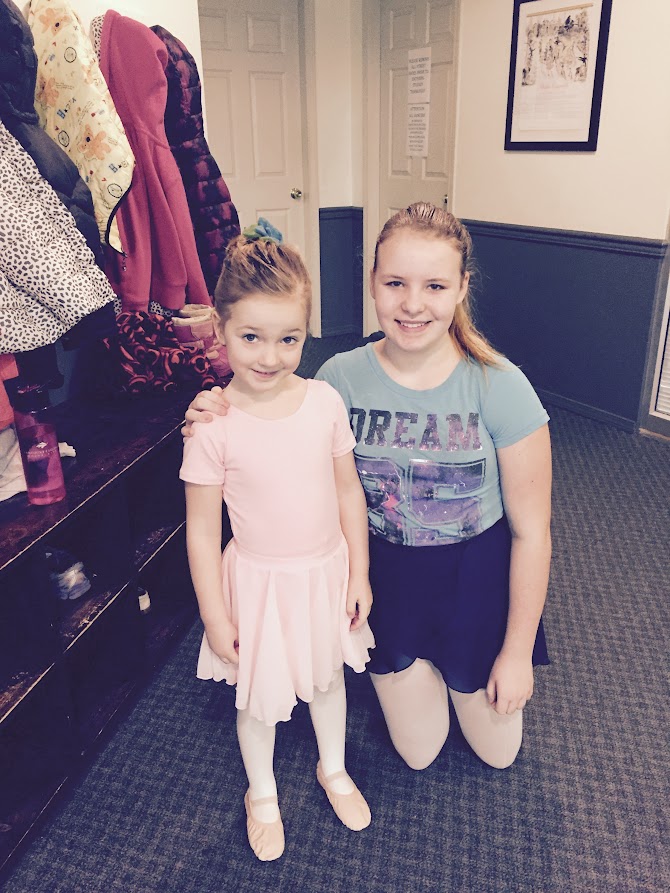
In 2016, My daughter Jane was just about to enter kindergarten, and now she is entering grade 10. My niece Mya was a 13-year-old teacher-helper in Jane’s ballet class, and is now entering her final year in my teacher education program.
Jane was on my mind when I wrote my first course syllabus for Social Studies Methods, knowing that she may someday have some of my students as her teachers. This week, as I work on my fall 2026 syllabus for Social Studies Methods, I’m also thinking about Mya, because she will be one of the year 5 students taking my class.
In the last few years, I have taken to wrapping up my courses by asking my students to reflect on what their students need of them, and what our society needs of us as social studies teachers. I can apply that thinking to my own planning.
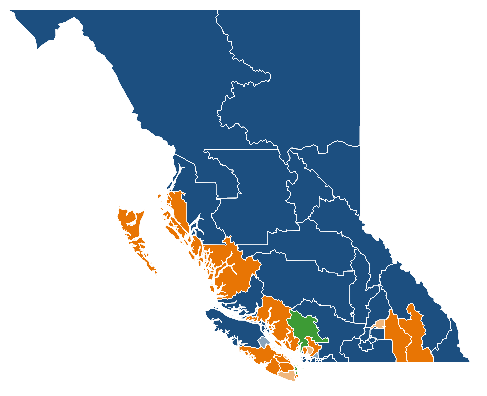
This image was BC Election Results as of 10am, Sunday October 20, 2024. Dark Blue = Elected Conservative. Light Blue = Leaning Conservative. Dark Orange = Elected. Light Orange = Leading NDP. Bright Green = Elected Green.
“What happened in Saturday’s Election?”
Monday morning will see students arriving back in classrooms across British Columbia, and many of them will be hoping to have this conversation in class. Nearly 180,000 of them had voted last week in Student Vote parallel elections, and hopefully many of them will have gone along with parents when they voted or watched some of the coverage of votes being reported, with some having volunteered for candidates or – for those 15 or over – having even worked as election officials through Election BC’s Youth at the Booth program.
I loved teaching elections in my 22 years in the classroom, and it’s something I miss now that I’m a teacher-educator. The “atmospheric river” that missed my house in north Nanaimo has arrived now, so while I wait for conditions to improve to take my dog out, I thought I would write this to share some of my ideas to build your students political data literacy through the still-evolving election results.
Here are some questions to explore, and associated strategies:
Who Won the Election?
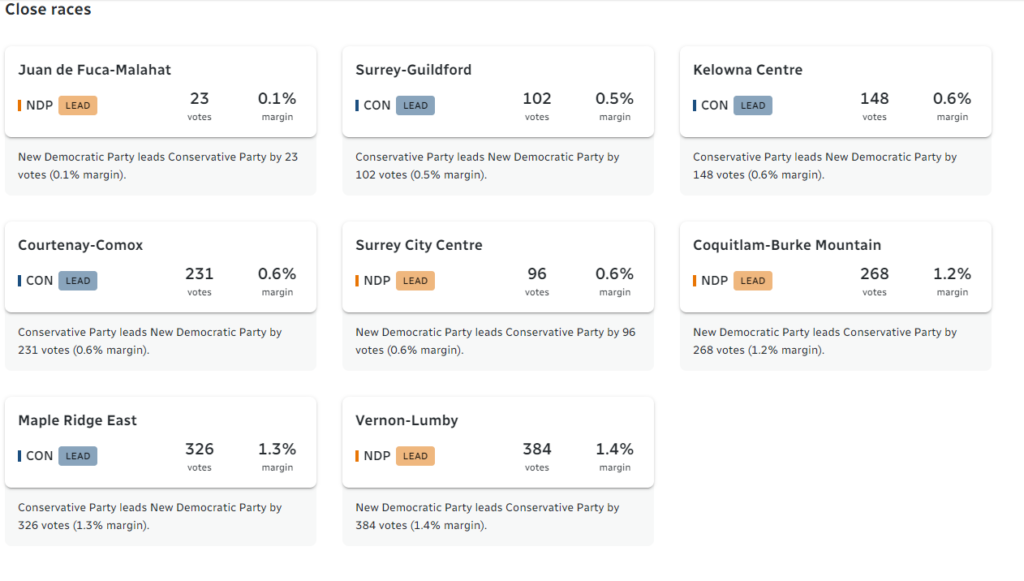
I will have to update this blog I suppose, as the view from the day after doesn’t allow us to answer this question yet. The preliminary count finished Sunday afternoon, but the final count will not be until October 26. This will include ballots that were not included in the initial count – about 49,000 of them. There will also be recounts in two ridings that had less than 100 votes difference, with the potential that others could be requested.
There are several very close races across the province at the moment. Among these votes are ones that were cast early at Elections BC offices, before Advance Voting started. Those might have been motivated voters who knew they would be away for voting, plus people working on campaigns or for Elections BC during regular voting.
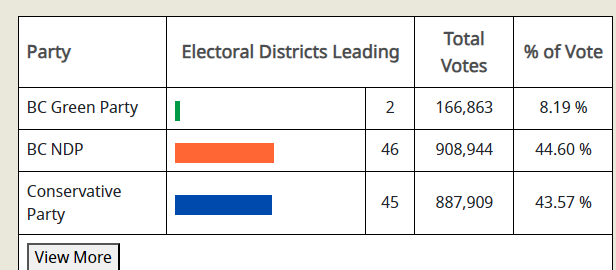
This is what the results look like Sunday afternoon:
For your students’ understanding of how elections work in our system, I think the most important thing to stress with these emerging results is that who wins is not based on the popular vote, or what percentage of British Columbians across the province voted for each party.
We had 93 separate elections yesterday, electing 93 MLAs. While usually the party that wins the popular vote also gets to form government, it doesn’t always work out that way.
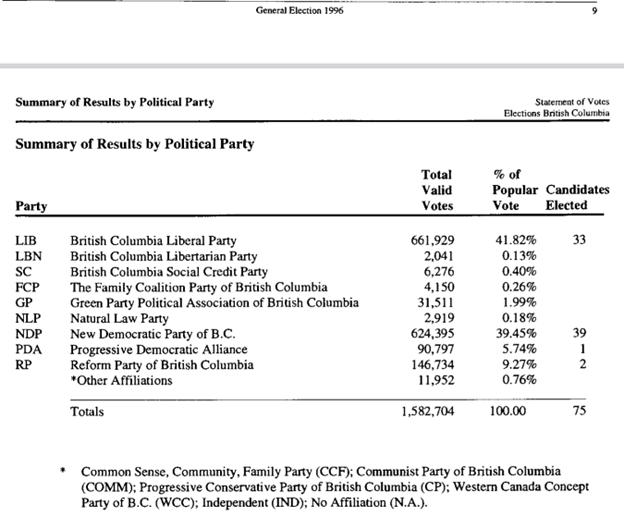
Idea: Have students look at the results of the 1996 BC election. Have them try to figure out who won.
No – not the BC Liberal Party. They won the popular vote, but the NDP had the most candidates elected.
How did that happen? The BC Liberals won by big margins in some ridings, but the NDP won enough close races, where they came first of a few candidates.
This is just how our first-past-the-post system works. It’s all legit, though this could be an opportunity to spin off into looking at different electoral systems and the benefits and drawbacks of different options for electoral reform. You could contrast this with the results of the 2001 election, which saw the BC Liberals win 77 of 79 seats with less than 58% popular vote, the NDP reduced to two seats, and the BC Greens win no seats, despite receiving votes from over 12% of BC voters.
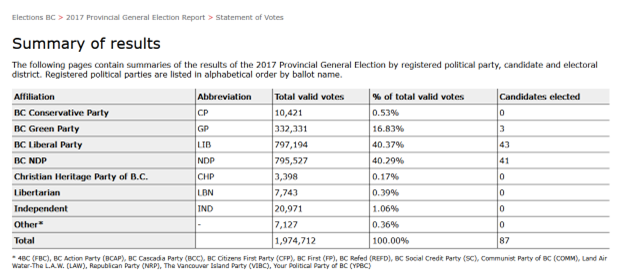
Comparison to 2017
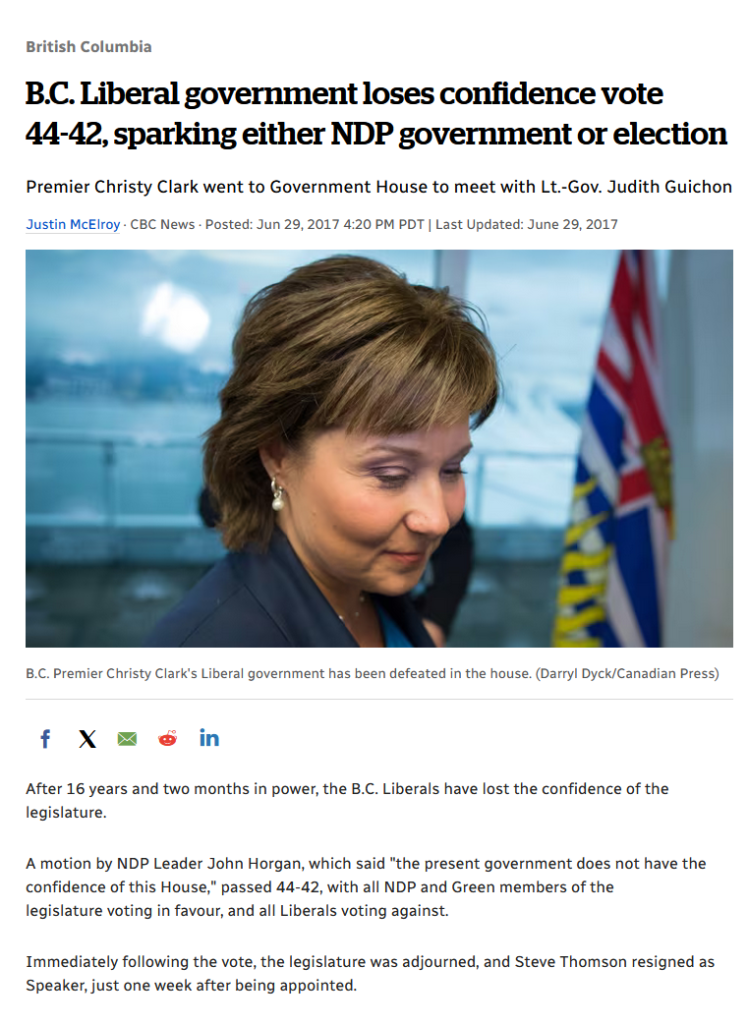
The example from history that might be most relevant to what will happen over the coming days and weeks comes from May 09, 2017, when the BC Liberals under Christy Clark just edged out the NDP, under John Horgan, in popular vote and won 43 of 87 seats to the NDP’s 41 seats, but ultimately an agreement between the NDP and the 3-member Green Party caucus, then lead by Andrew Weaver, saw the NDP form government.
I can’t do justice in just a couple of sentences in how all that went down and the role of the Lieutenant Governor, so if you’d like a reminder, check out this end of 2017 look back at the events from Global News.
While the election was held on May 09, it took several weeks for the government to be determined. As the BC Liberals were the incumbent government, Christy Clark had the first opportunity to test the confidence of the legislature. When the 1st Session of the 41st Parliament began in the last week of June, the government would face its first test. John Horgan brought forward a non-confidence motion which passed 44 (with Greens supporting NDP) to 42.
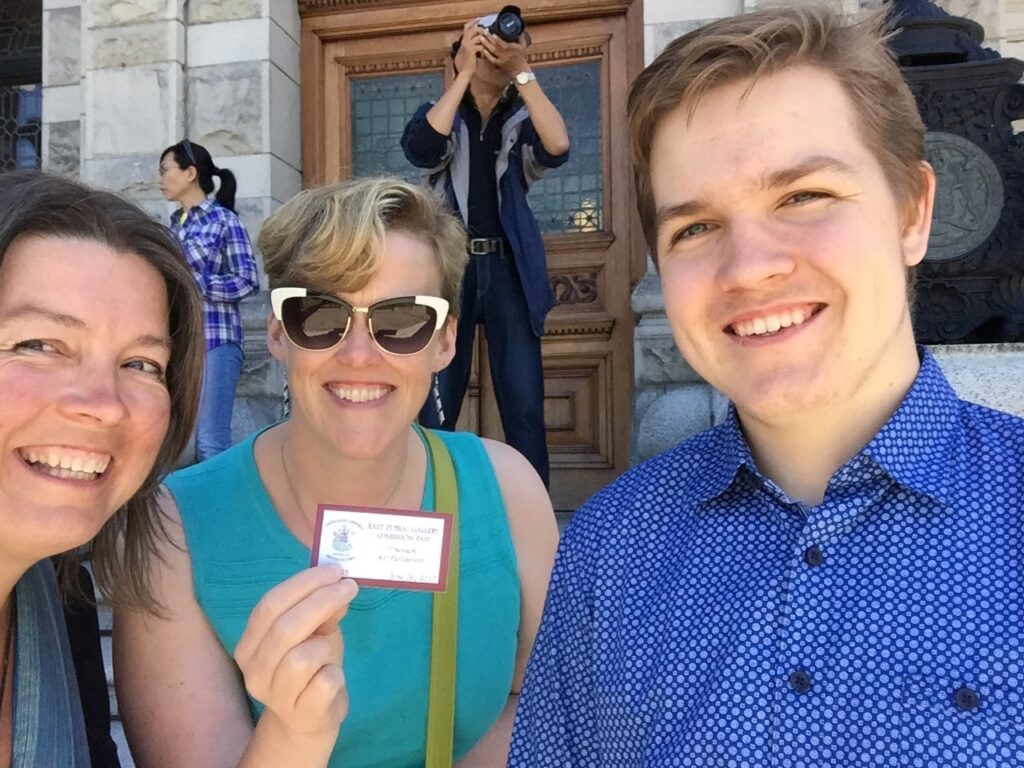
Fun side note…. My friend Cathy and my son Henry (then at the end of grade 10, and now a future 2025 legislative intern) and I secured seats in the visitor’s gallery through our then-MLA, Leonard Krog. We were holding up one of our tickets to the gallery, knowing the non-confidence motion we expected to see would likely be historic.
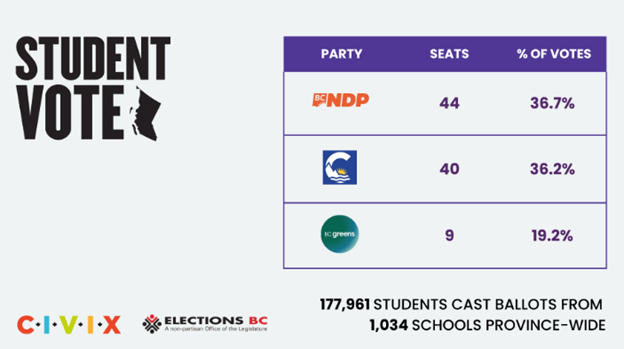
How did students vote in comparison?
As soon as polls close each election, CIVIX releases data on who students would have voted in Student Vote.
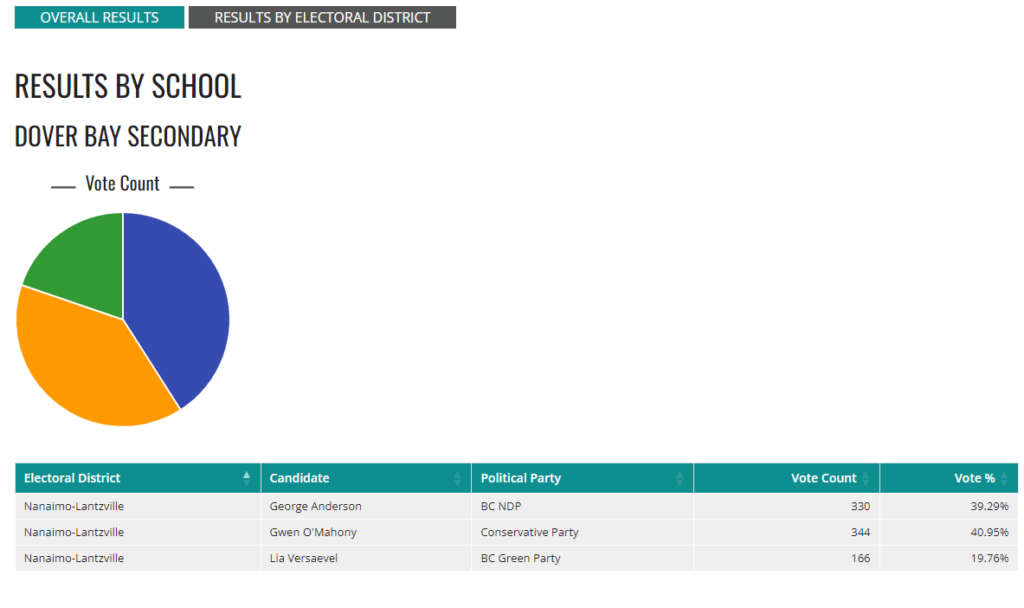
On their website, you can drill down to look at the data from the riding, and at each participating school. This can make for some interesting comparisons to the community as a whole.
My daughter Jane was a grade 8 elections official for her vote, so was refreshing the Student Vote website at 8pm looking for these results.
Where geographic thinking meets political data
The initial image that I shared in this blog, of the coloured map of ridings, can be an interesting provocation for some geographic thinking for students. You could…
Get them to list everything that they observe first, without making any inferences. They might notice the colours, and that the lines show bigger pieces and smaller pieces, and that the colours cluster in different place.
Get them to generate questions – what are they wondering about? Maybe they are curious what the colours mean, or why some pieces are bigger than others.
Go over what they notice and together try to answer their questions, then…
Try to make inferences. There is some interesting stuff you can get into if they start noticing where parties are more and less popular, etc. You can go deeper by looking at maps the show other information, such as the types of industries in BC and other demographic details.
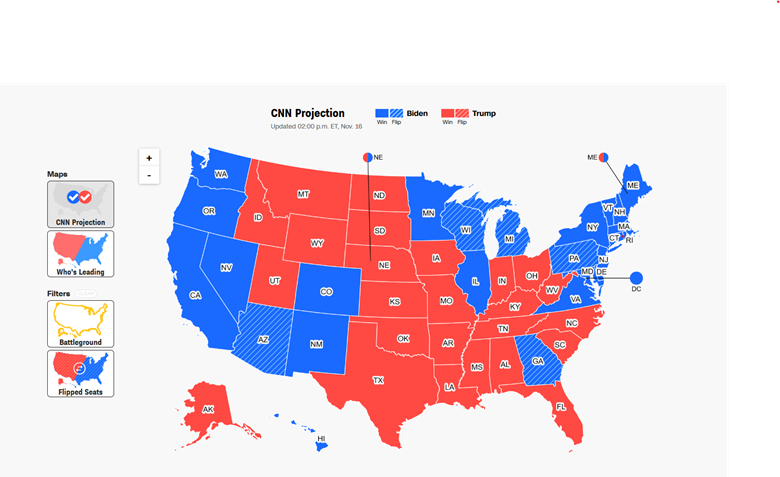
Hopefully you will also be following the US presidential election with students this fall, so you can also look at this fascinating pair of maps from the 2020 election. Get students to look at one, then the other, and discuss how that impacts their understanding of how Americans voted.
First the one that is very recognizable on CNN, and that looks like the map that Richard Zussman was using to explain ridings on Global BC coverage:
With the US electoral college having most states as “winner take all” the country looks very divided, with an image that entire states are filled solely with Republicans (red) or Democrats (blue). Just like our map gives the viewer an image that everyone in the Nanaimo ridings are New Democrats and everyone in the Fraser Valley vote Conservative.
Maps are made by people who choose what information to include and exclude, and what labels and colours to use.
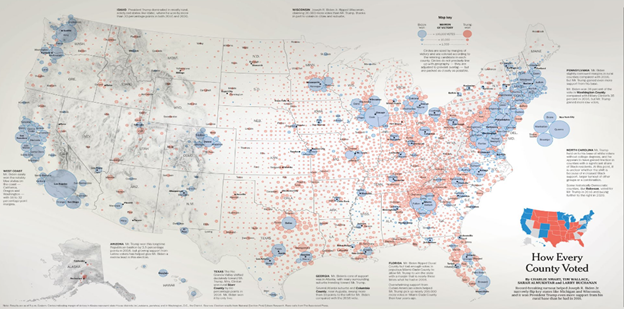
Contrast the image of the US with the same data from 2020, but now at the county level.
Same election, but you get a lot of different information about the country. See what they notice…. Urban rural divide, with cities more blue. States have diversity within them, even if all electoral college votes go to one presidential candidate…. population distribution etc.
The final report of the BC election will show poll by poll results. You can look at your riding and look for patterns. What neighbourhoods voted which ways?
Voter Turnout Inferences
At the end of the final day of Advance voting (Wednesday, October 16) a record had been set; over a million British Columbians had already voted! In some ridings, more than 1/3 of registered voters cast their ballots ahead of time. There was discussion about whether this would bode well for having higher voter turnout than we have seen in the last few elections, but ultimately only 57.39% of registered voters had cast ballots in the initial results (so this will go up a smidge for final count), which is on-par with the last 5 elections, but lower than voter turnout used to be.
Some ideas for discussion questions or data crunching:
An atmospheric river hit some ridings really hard on election day, with the North Shore and parts of Surrey seeing flooded roads, while my “riding to watch” – Nanaimo Lantzville seeing a few sprinkles in an otherwise cloudy day. Could weather have impacted voter turnout in some key ridings? Could it have made a difference in the outcome? Who would have been more motivated to get their rain boots on and brave the elements? Voters who were really wanting a change? Voters who were really inspired by a particular local candidate? Voters wanting to vote against a candidate or party they oppose? Voters who are really committed to a responsibility to vote?
Your students could do some interesting dives into data comparing rain amounts to voter turnout and outcomes. Some key learning would be consider these “inferences” and to try to judge how plausible they might be. Is a relationship between one factor and another potential causal, or is that too much of a stretch. We can’t know, but which inferences could be reasonable?
2. Why is our turnout not higher? You can look at voter turnout over time at different levels of government and find trends, as well as studies by Elections Canada and Elections BC that have surveyed non-voters to ask why they don’t vote. Some democracies around the world have mandatory voting, with small fines for those who don’t vote. What would be the benefits and drawbacks of that kind of system?
The interesting what ifs… vote splitting, independents, strategic voting etc.
Some of the most interesting analysis in the wake of this election involves looking at ridings that had interesting or surprise outcomes, and considering the “what ifs”.
This election was the “craziest” that veteran BC reporter Keith Baldrey has said he has ever covered, and he began in 1983. Between the implosion of BC United (former BC Liberals) to the meteoric rise of a BC Conservative Party that was polling at less than 2% for most of my lifetime, to the scandals around the views and social media posts made by some of their candidates, this was a doozy.
If you feel like you need some more background, I would recommend this Globe and Mail Decibel podcast interview with their legislative reporter Justine Hunter.
Your students can look to some of the ridings and see if they can spot any vote splitting.
There were some ridings where the independent candidate (usually someone who was supposed to run for BC United and didn’t get a chance to) earned more votes than the difference between the first and second place finishers.
There are also ridings where they Green Party candidate earned more votes than the difference between the NDP and Conservatives.
Get them to play with looking at some “what if” scenarios with close ridings, but then follow up.
It can be tempting to just imagine “if that person didn’t run, then candidate X would have been elected”. Talk with students about how that isn’t necessarily the case.
Sometimes having an independent, or perhaps a Green candidate, would have brought people out to vote who would have otherwise stayed home if they had only two choices. The Greens have often argued that they don’t take votes away from anyone else, but that they increase the pool of voters.
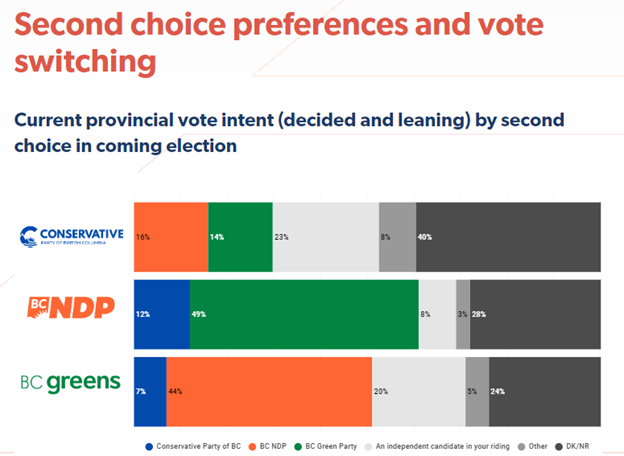
Who a voter’s second choice would be in an election isn’t always exactly crystal clear. I found the firm Earnscliffe’s analysis of voter intentions quite interesting. They report has a lot of this kind of data to look at:
It’s interesting to look at who they 2nd choices were for the people they polled, but that for some, there was no second choice as they picked DK/NR (don’t know – no response). 24% of Green voters went DK/NR, and they didn’t have a candidate in every riding.
Polling Data
If you are working with secondary students, one of the types of political data literacy that I think is quite important is to understand how opinion polling works, and the impact that it can have on voter behaviour. We are well, well past the days when we would all dutifully pick up when a call came in on our landlines, then answer the questions of the polling firm employee on the other end of the line. Firms these days use either online panels (that people have to sign up for) or IVR, or “robocalls” where a computer calls you and hopes that you will pick up even instead of screening out their call. Firms balance the results they get with methods as they know they are getting fewer youth, etc., but are often missing whole segments of the population.
So it can be interesting to look with your students at the polls that were released to the public. Which ones were more successful in capturing what happened? What methodologies did they use? What about polling aggregators like this one? What did they get right and what did they miss? How is this data different?
The excellent BC podcast Hotel Pacifico, hosted by Kate Hammer, Mike McDonald, and Geoff Meggs, has been an excellent source of insight into polling data and how we should interpret this. Mike crunched the numbers in each of the episodes they did daily during the campaign, and I’m sure we’ll here more analysis of how the polling did when they drop their post-election episode.
Polling can influence voter behaviour, as it can nudge us to join a bandwagon, jump off a sinking ship, vote strategically, make sure to line up in the rain to vote, or stay home in our jammies. Understanding what’s happening under the hood isn’t just for political science and stats nerds… it’s something all voters should be aware of.
Last Words
The “evidence” curricular competency in Socials connects to historical evidence, but some of the most authentic feeling evidence work connects to political data literacy and geographic thinking. Elections are a great time to jump in.
I did this kind of work after each election over a couple of decades. I promise the students will be more interested than you might imagine they would be!
Last week the Royal BC Museum reopened their “Old Town” gallery, which had been closed since December 31, 2021. The First Peoples Gallery and Becoming BC stayed closed and will remain so until after a long process of consultation and major redesign. The excellent Our Living Languages exhibit was transformed into travelling exhibits, which are currently on display at the Agassiz Harrison and Fort Nelson Heritage museums.
I will not wade into the long series of events that led to the November 03, 2021, announcement of this closure, or the series of developments and decisions that led to the May 2023 announcement that just Old Town would re-open.
I will instead focus this blog on how the process underway at the RBCM became a cool professional learning opportunity for some teachers and education students, and how it can also be something to inspire more critical history teaching in museums in schools.
A brief interlude to situate myself in this story…
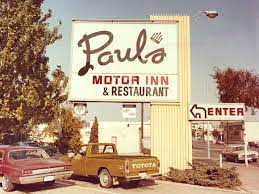
I spent a lot of time in Old Town as a kid. Every month or two when my Dad was alive (I lost him just before my 11th birthday), he and I hopped into the Buick Century station wagon to drive to Victoria from Nanaimo. We had lunch and Boston Cream Pie at Paul’s Restaurant then spent a couple of hours on the 3rd floor of the RBCM.
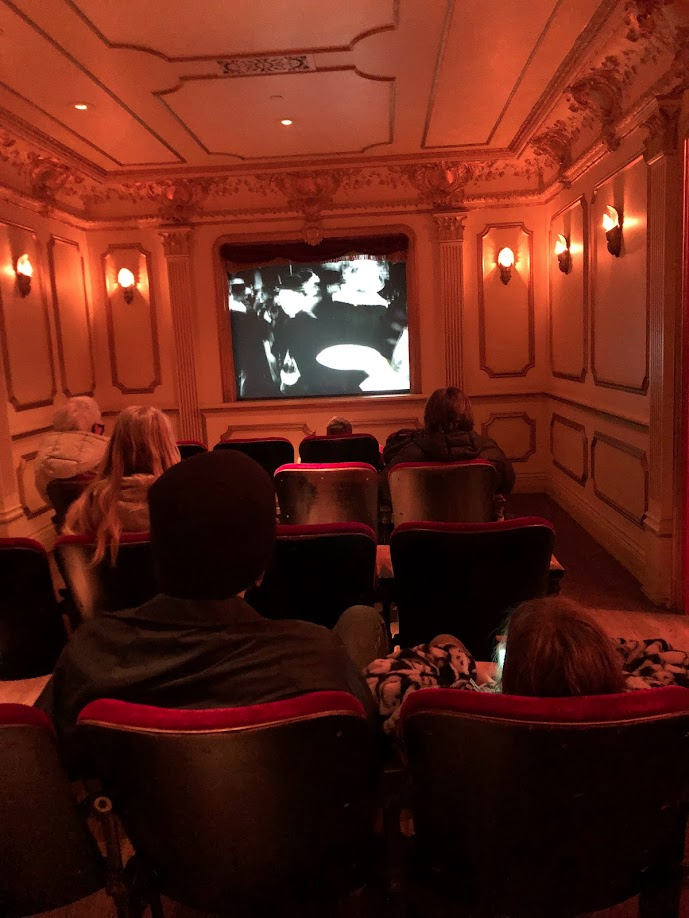
My favourite spots to linger were the silent film theatre, the train station, and outside the kitchen, smelling the apple pie. It was quiet and dark and immersive. Once my husband and kids and I returned to the island from Vancouver, the regular trips from Nanaimo to the museum began again, this time with a new tradition of ice-cream from Beacon Hill Drive-In. It felt like nothing had changed in Old Town from my childhood, apart from the 1992 addition of a Chinatown exhibit in Old Town that had been developed in co-operation with the Victoria Chinatown Lions Club, but has also been critiqued in its portrayal of that community.
As a history-teacher-mom, I did my best to top up the experiential with the analytical on these trips, but then I, too, would be lured in by that smell of cinnamon and the shadow of the passing train.
My family made a trip to the 3rd floor on its last day open.
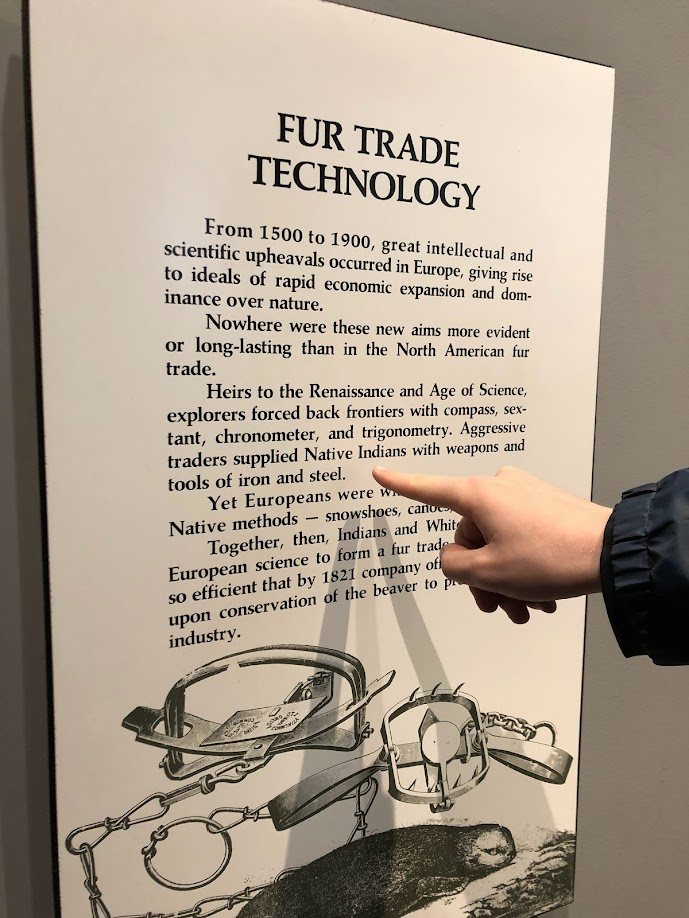
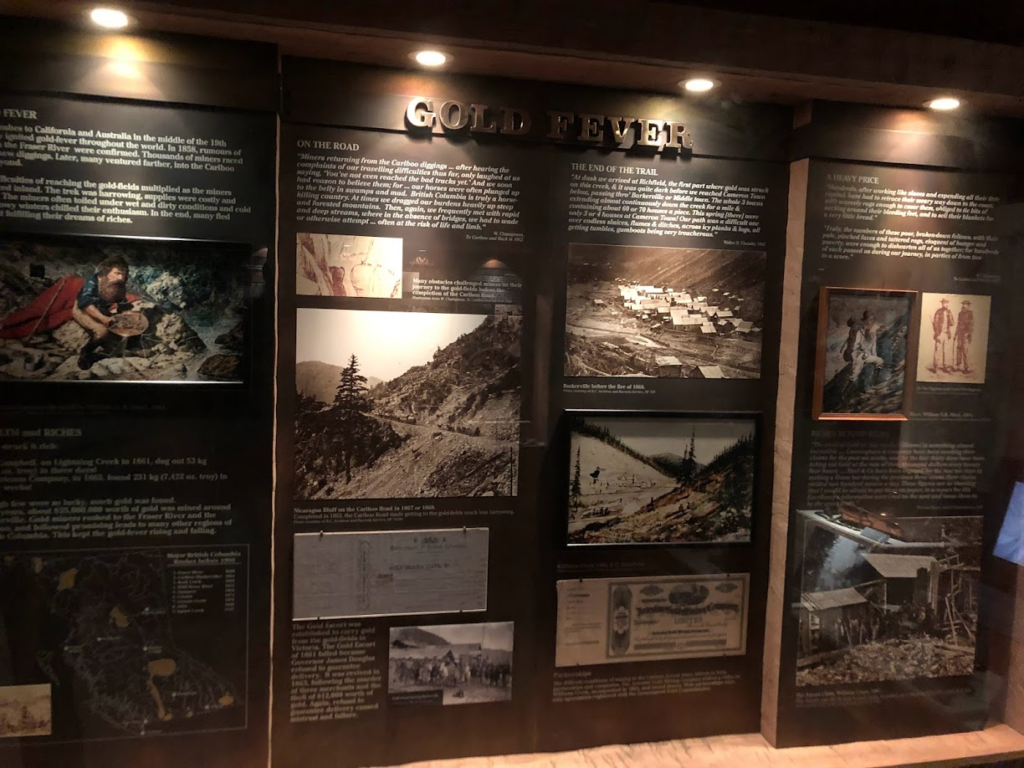
I was now teaching Socials Methods to future teachers and one of my sons was studying history and political science at university, so we moved through the galleries with a more interpretive focus. We carefully read the panels in Becoming BC and wondered how long it had been since anyone considered rewriting them:
We discussed the stories that a visitor would take away from the exhibits and those that were missing. Where was the Japanese Internment? Nowhere. Would anyone learn about the Fraser Canyon War in the gold rush exhibit that had been introduced in 1992? No.
As we considered the layout of the entire 3rd floor, we also thought about what it might convey about the shared history on this land that the First Peoples Gallery was physically entirely separate from the settler one.
Were we also feeling nostalgic and that we would miss visiting? Yes – that too.
The photos I took that day, I would later share with my students to get them engaged in some thinking about museums from our classroom.
A Unique Opportunity for Professional Learning
When the RBCM embarked on their public consultation process about the future of the museum and announced that Old Town had not actually been dismantled, I contacted Chris O’Connor, the RBCM’s Director of Community Engagement and Regional Partnerships, and my UBC colleague Dr. Lindsay Gibson, so we could discuss getting teachers and education students connected to this process through a professional learning session. I was intrigued by the prospect of doing this work in the closed parts of the museum, and hoped that would draw participants to come out on a lovely spring Saturday afternoon.
As we began our planning, there was another important announcement. The government issued a press release announcing that Old Town would reopen to visitors on July 29, 2023. There was now a timely – urgent, even – process that museum staff would be following to get Old Town ready to reopen, with changes.
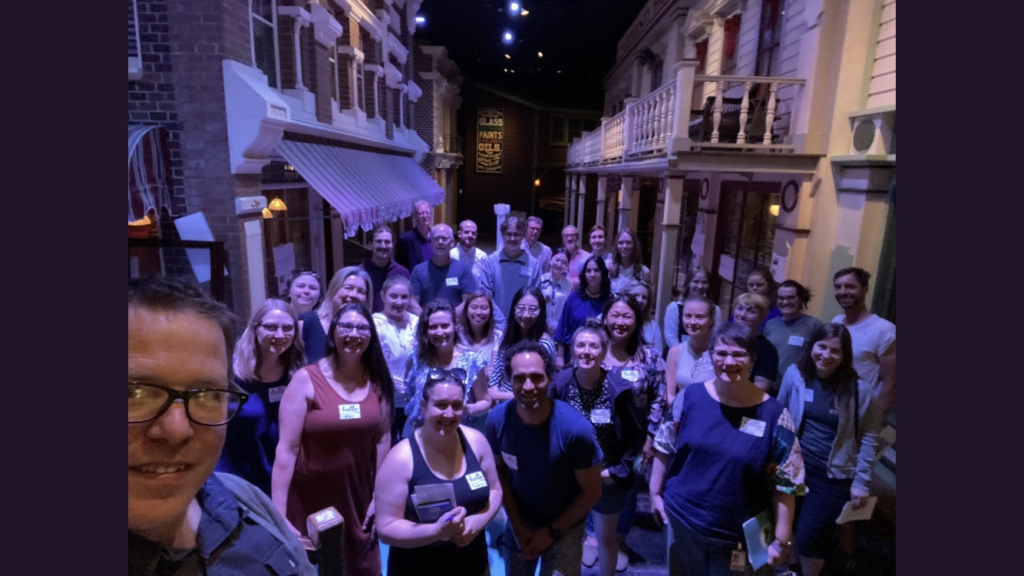
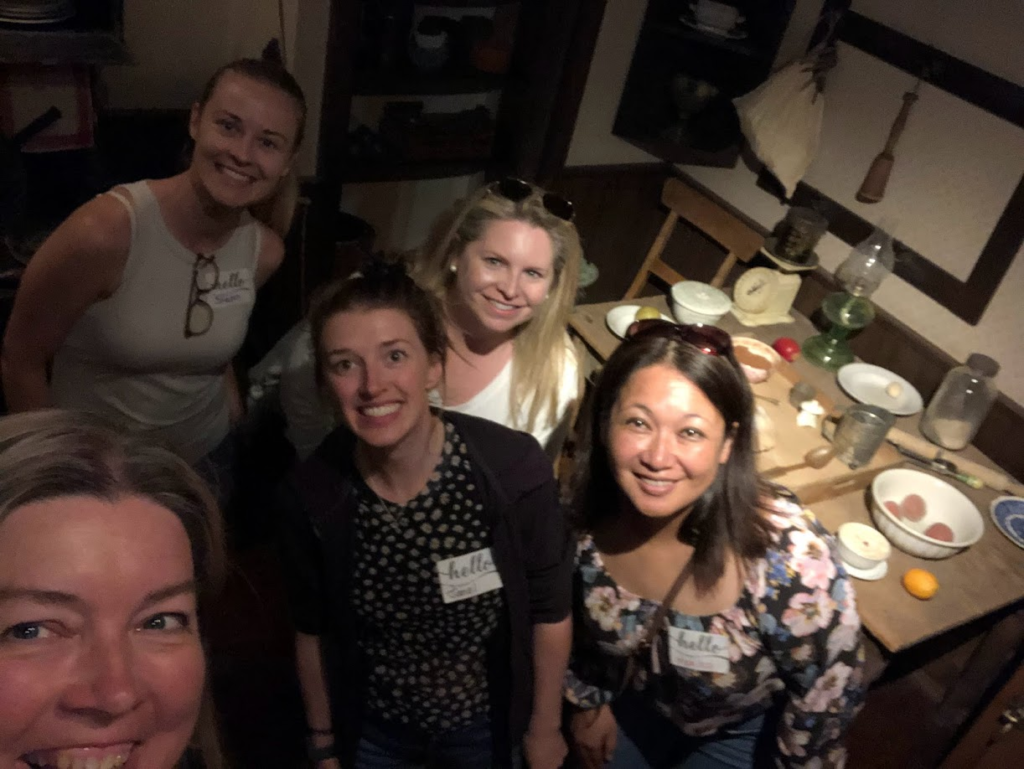
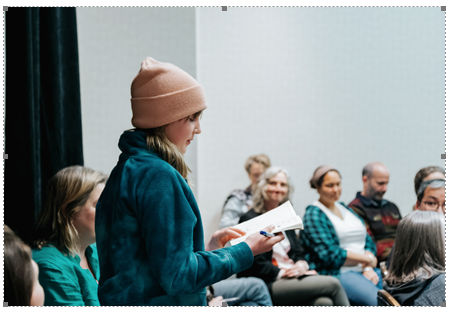
Our free (and fully subscribed) session “Thinking Critically About Museums” was held at the RBCM on May 27. 35 teachers and teacher candidates from up and down the island and from the lower mainland came together for the afternoon.
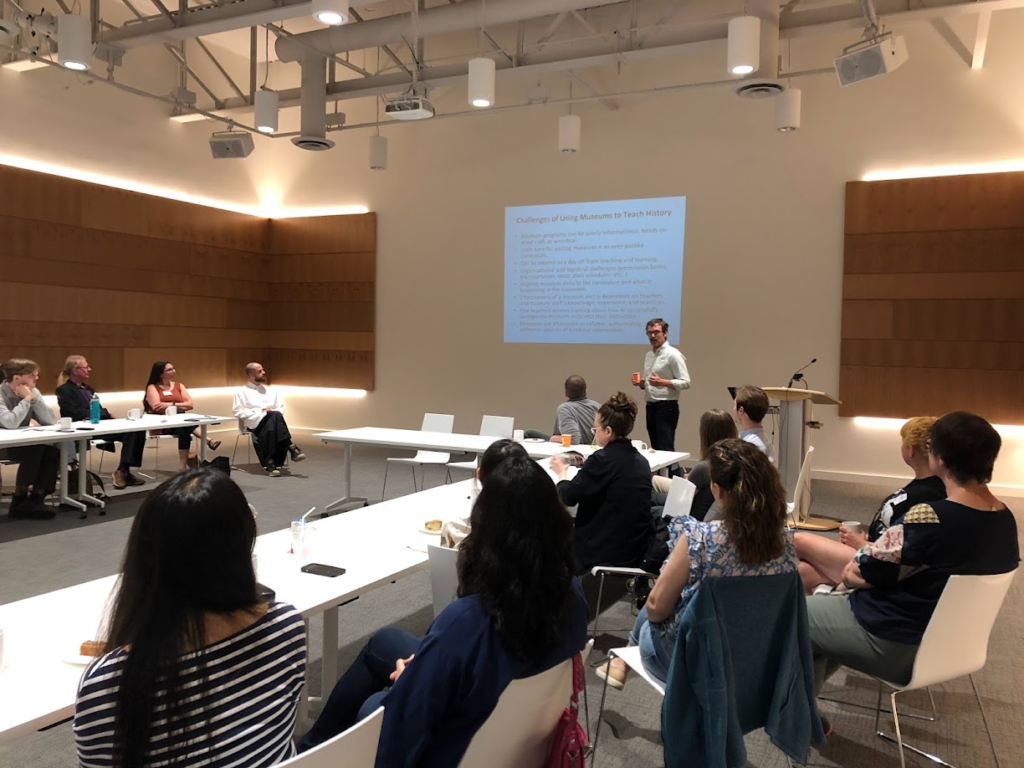
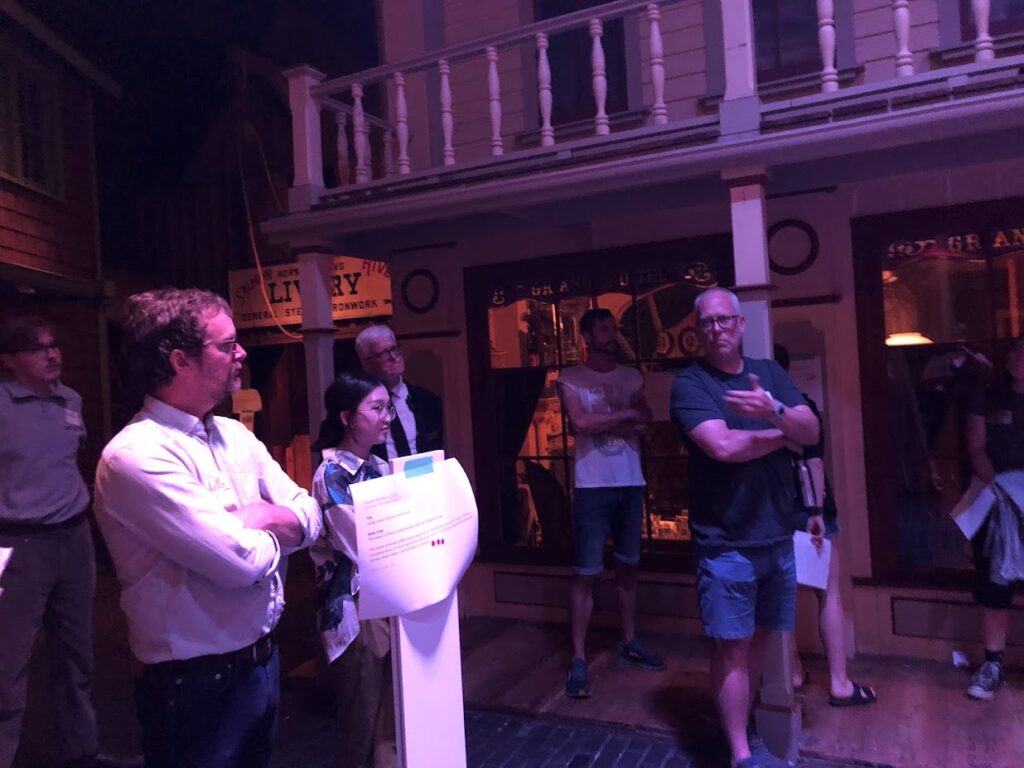
Lindsay started us well by discussing the high level of trust Canadians have in museums and some of the benefits and challenges of using museums to teach Social Studies.
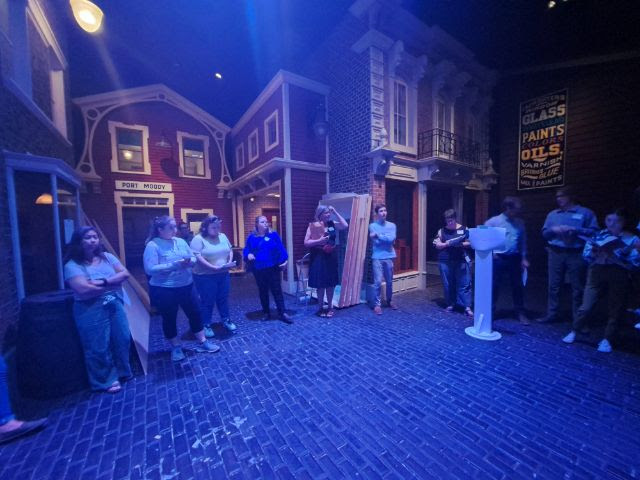
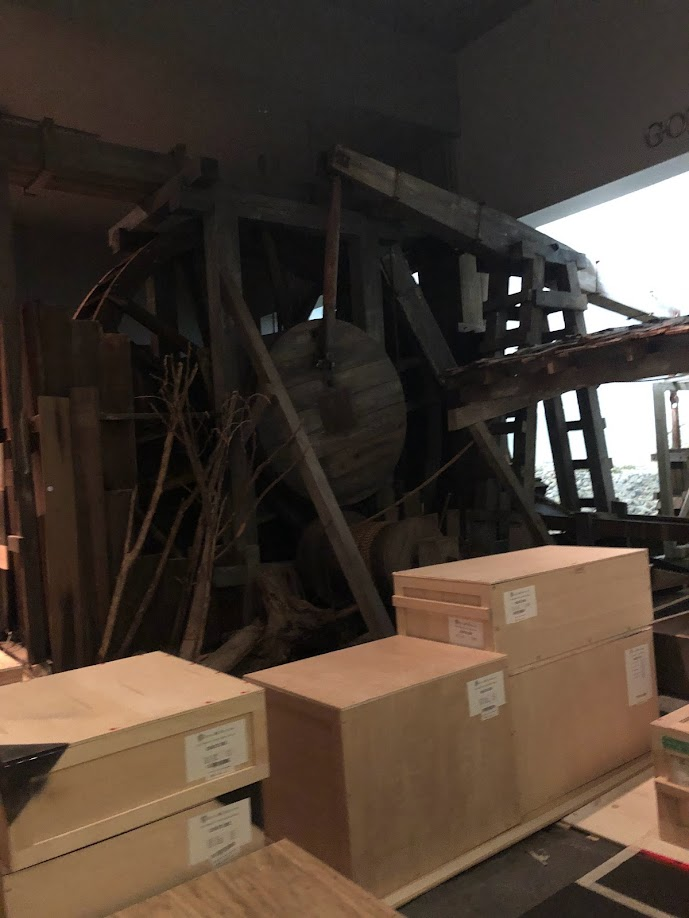
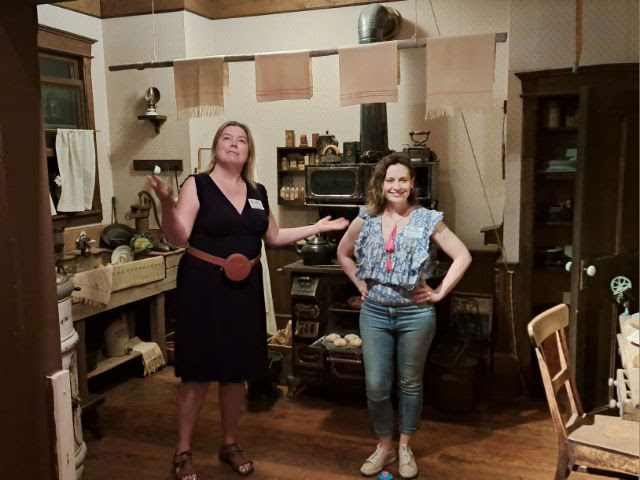
Chris then shepherded us into the staff freight elevator to the closed 3rd floor. There was a sense of some giddiness as the elevator rose. The doors opened to the former 20th century exhibit, its display cases now gone and replaced with an empty flex space for future exhibits. We began our tour of the closed Becoming BC in the farm yard. While the horse and the Discovery ship at the other end were still in place, many other parts of this gallery were now disassembled.
We arrived in Old Town and found the gallery we remembered was largely the same, apart from an empty storefront and a room in the hotel. Pieces of paper with photos, notes, and sticky dots were placed around the gallery as part of the process that museum staff were using to decide what elements to keep and those to add to or redesign.
Old Town has always been an immersive gallery, but text panels were now to be added to give more context and share additional stories that have not been told there before. Some flex spaces would be introduced to allow a rotation of new stories and artifacts to be showcased in the space.
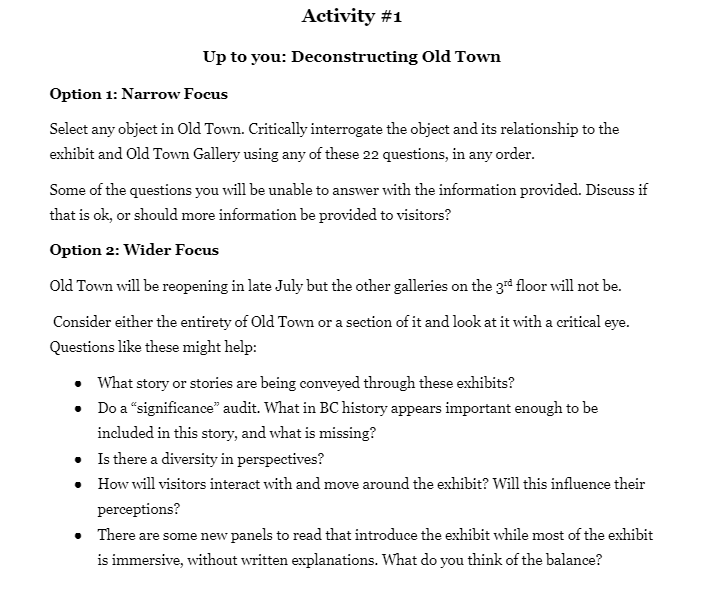
Activity 1: Deconstruct
Brent Geerts, a Belgian PhD student had joined our team. Brent was visiting BC for a month to examine how BC museums approach re-imagining our colonial legacy, an issue that resonates in Belgian and other European museums.
For our first activity, Brent offered participants a list of questions they could use to deconstruct objects and exhibits. The list was inspired by one he had located in a German museum. Some of the questions will seem familiar to anyone who was engaged students in interrogating artifacts, but others were newer to me. Brent had particularly highlighted the value of asking questions about the provenance of objects in the museum.
9. How did the exhibited object end up in the museum?
This is timely and important both for the RBCM and many of the other museums Brent studies. The full list of questions is available here.
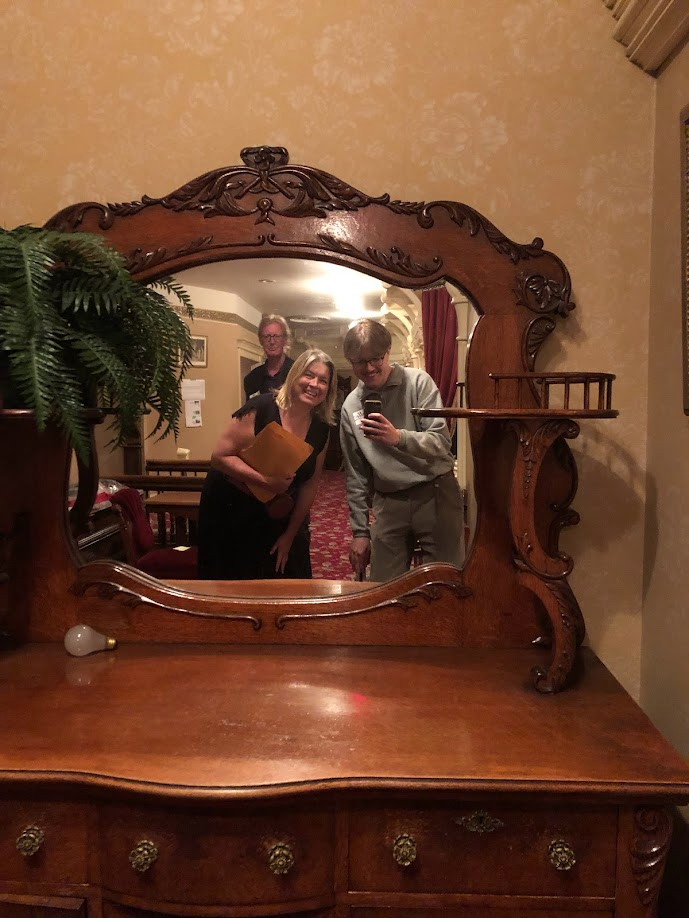
At this moment I will take considerable responsibility for a short delay in beginning our analysis of the exhibits. Some of us were too busy posing for photos. My history student son Henry was back with me again, along with our friend, BC historian Dan Marshall. We captured Dan photo-bombing us.
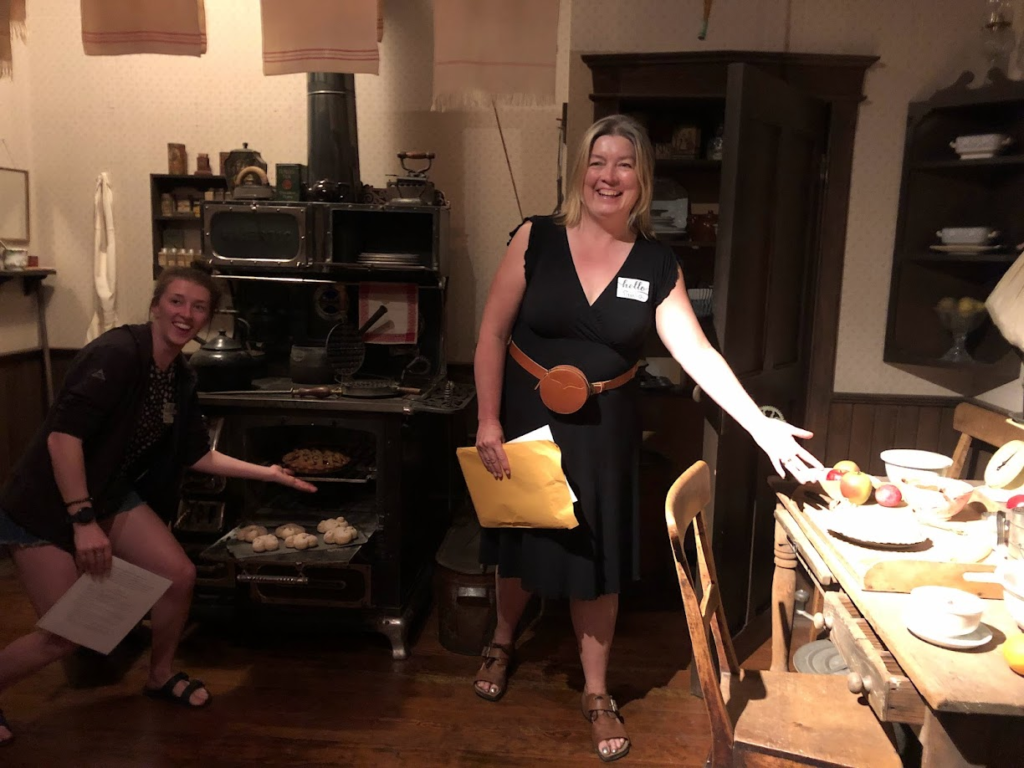
Then… LOOK!! WE ARE ACTUALLY IN THE KITCHEN WITH THE PIE WE SMELLED FROM BEHIND A BARRIER FOR DECADES!
Luckily Brent’s questions were so interesting and important that we were back “on task” quickly. We came back to share what we were able to notice when we looked at the galleries and artifacts with a structured critical lens, and how we could do the same with students in this or any other museum.
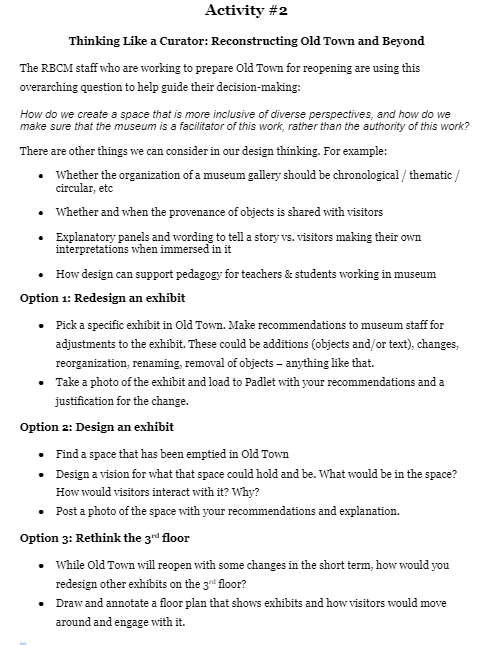
Activity 2: Reconstruct
I led the group’s second task in Old Town. As we had spent time deconstructing the gallery, now it was time to put on our curator hats and think about how we might redesign a particular exhibit or even the entirety of the 3rd floor.
We captured and shared our ideas on a Padlet, then moved back downstairs to engage in a feedback session, led by Chris. Just as Chris and his colleague have been travelling around the province collecting feedback to inform the future of the museum, the teachers and future teachers at our session now offered their perspectives.
A summary of the results of the first phase of the museum’s consultation process and opportunities to participate in deeper discussions in the next phase are at this page. With Old Town now open, visitors to that gallery will also be invited to give feedback on what they experienced in the visit and what they would like to see for the future.
Authentic Learning
The tag-line for this blog and the focus of much of my interest in research and teaching is about the value of situating learning in real-world places, problems, and processes.
It was important to me that we have this session immersed in the gallery we were considering, even though we would have been able to accommodate including many more educators from around the province if we had done the session online. I wanted to get across the power of using our senses to experience a place while engaged in this hard thinking about it.
This is certainly also an authentic problem and process. That people across the province have been expressing passionate opinions about the future of the RBCM and how it tells the multitude of stories of human history in BC makes for a uniquely authentic opportunity for teachers to directly engage their students in this conversation. This is a process not just for high school students, but younger kids too. My 11-year-old daughter Jane tagged along with me to a public consultation meeting in Nanaimo in February, and decided to stand up and offer her suggestion to have more interactive features in the galleries, like the ones she had used at MONOVA and the Museum of Vancouver.
Authentic participation by students in the work of the museum is not anything new for the RBCM, as prior to the pandemic, they worked with schools in Greater Victoria in a Partner School Project. One of our teacher-participants had partnered with the museum to bring his students into the museum several times, and his students’ research and exhibits had been shared with the public in a temporary display. Imagine what kind of learning that must have been for those students!
The work that we did in our May 27 session was also meant to be transferable to visits to and collaborations with community museums across the province.
Have you used museums in a way you’d like to share? I would love to hear your ideas and questions in a comment.
My daughter is in grade 6 this year. She stumped me yesterday when she asked “what is the most intimidating thing in the world?” I didn’t have an immediate answer. It occurred to me that a lot of people might say “public speaking”, but she has “motivational speaker” near the top of her current future job list, so clearly that wasn’t going to be it.
I shrugged.
“A Blank Piece of Paper” she announced (with all the exaggerated gravitas of someone who gets paid for public speaking engagements).
This, after having complained about writer’s block twice in the first weeks of school. The blank piece of paper stared back at her each time, when even with detailed instructions and some written prompts, she couldn’t begin for several minutes. She had hoped none of her new teachers would think she was daydreaming.
I wondered if some visual / graphic support would have been useful as scaffolding.
I like to have fun offering alternatives to the blank piece of paper for my students.
Several years ago, I stumbled upon the National Film Board’s Oscar winning documentary “If You Love This Planet” on YouTube. For those of you who are too young to have seen this (or whose minds have tucked this bit of horror way back on a dark shelf), this program featured Dr. Helen Caldicott, president of Physicians for Social Responsibility in the USA, making an impassioned plea for nuclear disarmament. The film cut between her speech and alarming images of mushroom clouds. My mother had sat me down at age 12 in front of our tv and we had watched this together. It was 1982.
I decided to show this film to my grade 12 history students when we were examining the nature of the arms race and the campaigns for nuclear disarmament in the early to mid 1980s. Before we watched, I gave them each the dreaded blank piece of paper and asked them to draw a stick figure head of me in 1982 – 12-year-old Paula Poikonen of Nanaimo – whose sense of safety and security in the world was about to be shattered.
Their task while watching was to add time stamped thought bubbles to stick-head Paula. What would she have been thinking as she watched, 2 minutes in? 4 minutes? I have never seen students writing in response to a video with as much passion before or after. I credit stick figure Paula as much as the source material.
We do all tend to use some forms of graphic organizers, but they tend to be the same ones over and over. Which ones are most popular?
Let me guess…
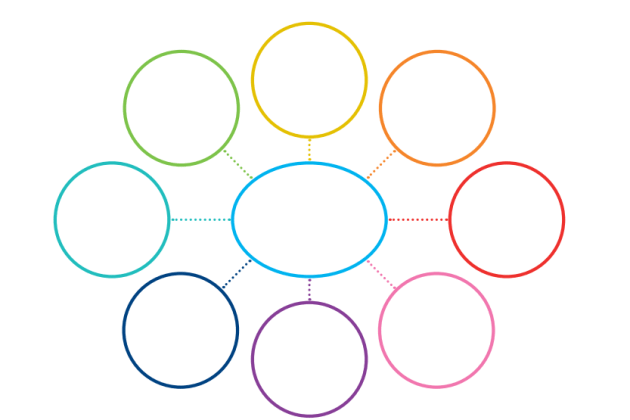
Mind Map
2. T-Chart
3. Venn Diagram
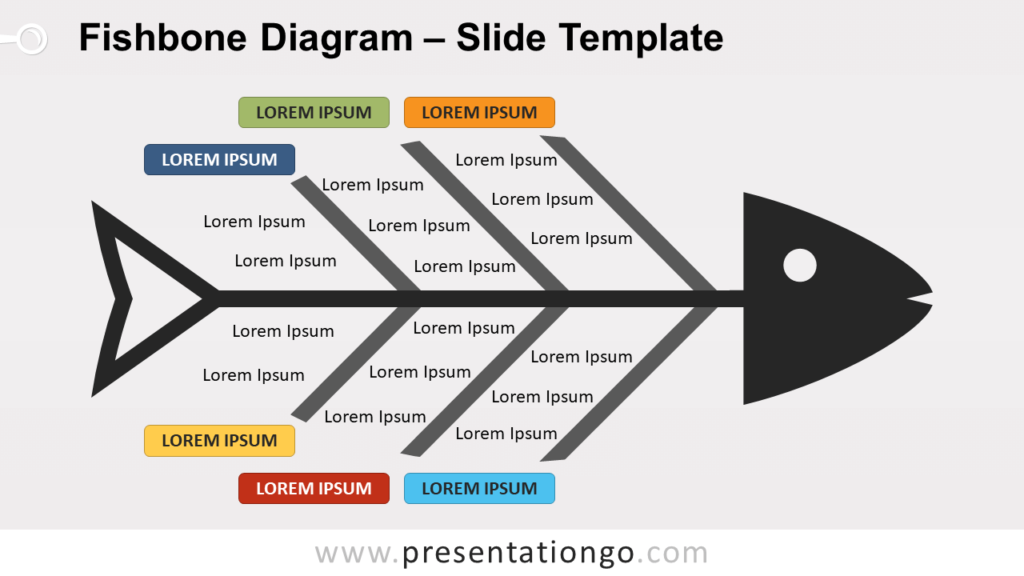
Or for those of you who teach Social Studies, how about the famous Fishbone diagram for causation?
There is a reason that these ones are so well known and commonly used, as they offer simple and clear guidance for a) brainstorming b) pros and cons c) finding similarities and differences, and d) seeing that there are multiple causes of most anything.
In reviewing lesson planning for hundreds of future teachers each year, I have noticed a couple of trends when it comes to the use of visual / graphic organizers.
They are not used often enough. Hey – I also tend to want to rebel against anything that could be labelled a “work sheet”, having grown up filling so many boring ones out. In wanting to embrace rich thinking and inquiry, a few steps are often missed in scaffolding student thinking. Instead there are blank spaces in time and empty google slides presentations and pieces of chart paper where thinking should magically appear.
2. We know and love the organizers that we know, so without thinking about them, we over apply them, using them for purposes they weren’t designed for. For example, consider the cool fishbone. If your learning intention is to have students understand there are several causes of X and what they entail, the fishbone will support that.
But what if the benchmark in the “cause & consequence” competency that is most relevant to your investigation is about long vs. short term causes. Or direct vs underlying. Or intended vs. unintended consequences. The fishbone won’t help with that.
TC2 has a graphic organizer for SO MANY THINGS, recognizing the value of them as “tools for thought” in scaffolding student critical thinking and work with various disciplinary competencies. A membership is worthwhile to be able to access their collection alone, but that is only a fraction of their quality resources.
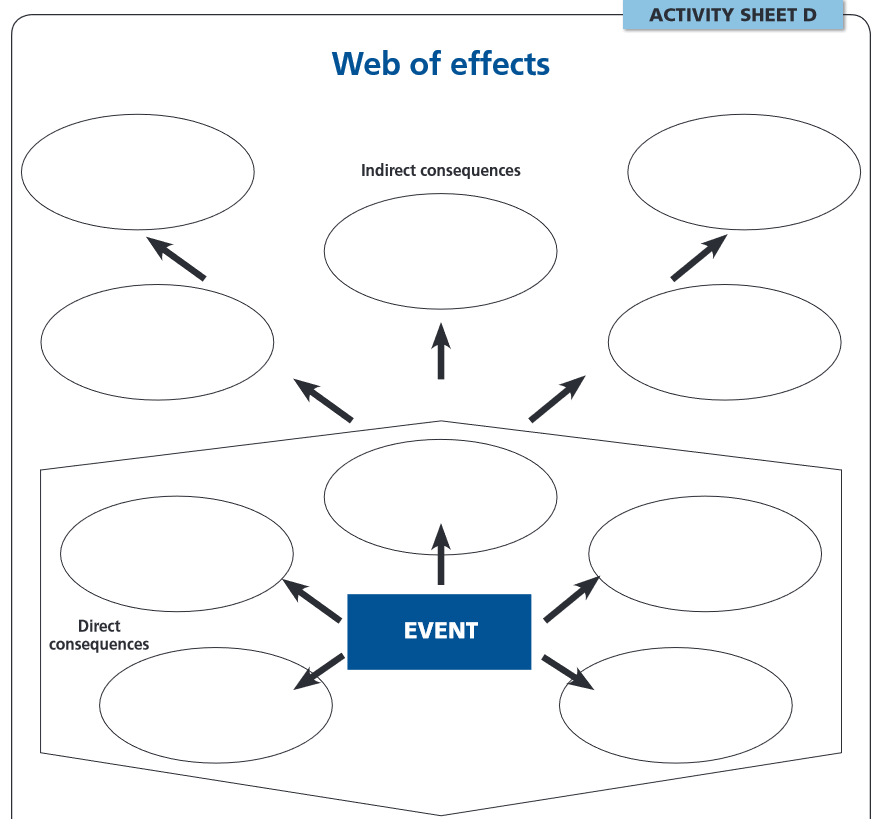
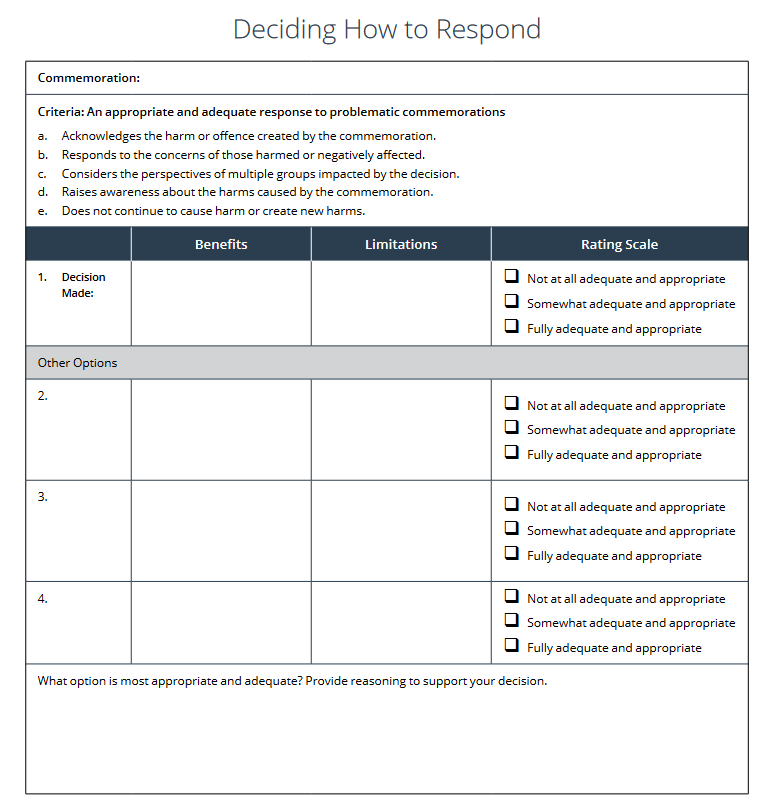
Here’s another example from their excellent – and free – new resource on historical commemorations, by James Miles (edited by Lindsay Gibson). Note all the ways that student thinking is guided in this activity sheet:
You can make your own! Or better yet, as your students to come up with an organizer that best supports the thinking required. They don’t have to be hard to make or look like you hired a graphic designer.
Example:
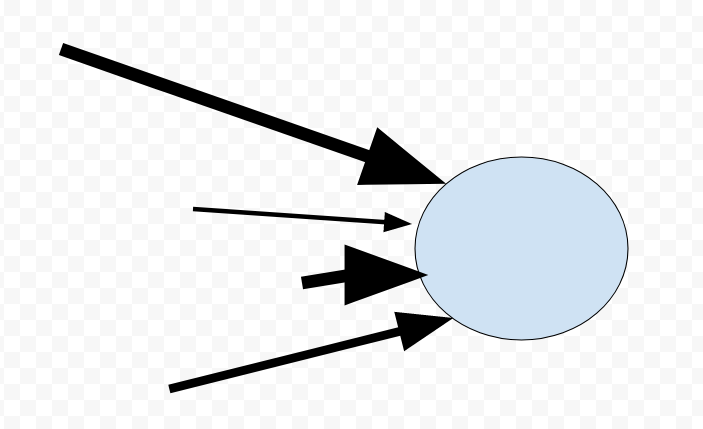
I used to ask my students to judge the relative significance of different causes of the First World War by drawing arrows of varying length and width coming into a central ball representing the war. Longer lines were for long term causes, like imperialism. The assassination of the Archduke Franz Ferdinand had a short, stubby line, as a spark. How important was militarism in relation to nationalism? Students adjusted the thickness of their lines based on their take on the significance of each. These student-drawn small diagrams conveyed a lot of meaning and were easy to look at and compare, so they could walk around with their diagrams, entering discussions with other students.
Here’s what I mean. You would have them make it with markers rather than doing it yourself, but I just made one using Google Drawing. It took about 2 minutes to find the right shapes and to remember how to adjust line width:
Why do this?
Research in the use of authentic assessment (eg. Wiggins, 1989; Gulikers et al., 2004); Koh & Luke, 2007) emphasize the value of giving our students real-world, complex problems that have value outside of school and require knowledge manipulation. Koh, in her Oxford Research Encyclopedia discussion of the literature on authentic assessment emphasizes the need to use supportive task framing, such as content, procedural, and strategic scaffolding, to support the complex thinking students will need to do in these authentic tasks. That scaffolding can allow our students to begin to grapple with real-world, important issues, even the nature of this thinking is entirely new to them.
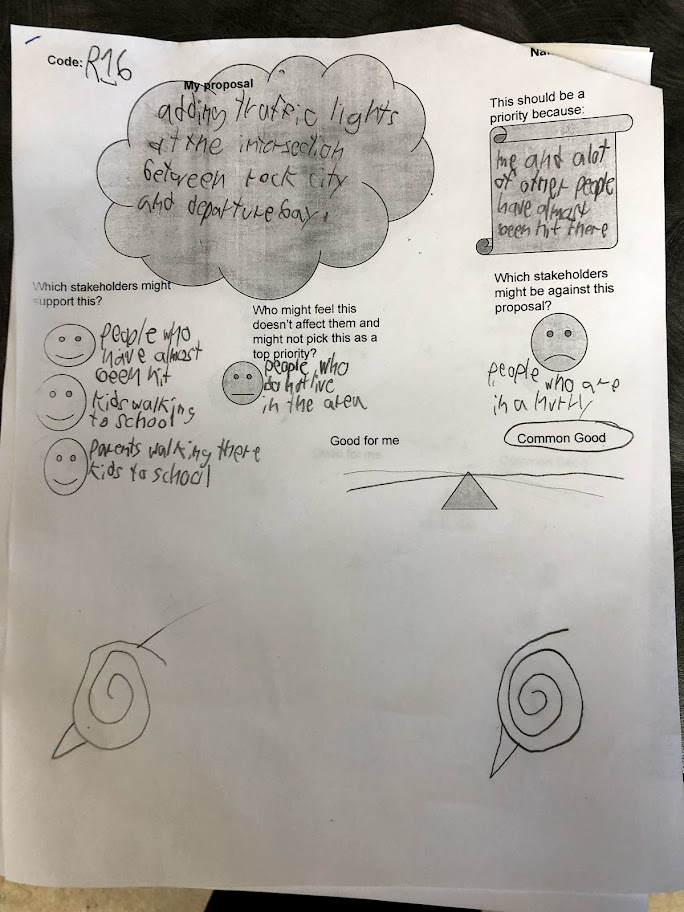
In my dissertation research, students in grades 6 and 7 generated ideas for the future of their city, then deliberated with their classmates on which ideas they should prioritize in submitting to a real-world public consultation process, via a meeting with a member of city council and a city planner. Their teachers and I used a variety of types of scaffolding, including graphic organizers.
Imagine if instead of the thought cloud, expression faces, and teeter-totter fulcrum, we’d handed them a sheet of blank paper to write on, or asked them to do the same thinking with a list of questions…
This was engaging, and gave students familiar visual prompts to support complex thinking about abstract, challenging issues.
Caution
My last word – for now – is a word of caution. These graphic organizers can be powerful in how they convey meaning. Before you use one, consider the potential unintended consequences if one shapes perception in a direction that you didn’t intend, or didn’t anticipate.
For example, I see ladders everywhere.
In real life, to safely use a ladder, one would start on the first rung and not skip any as you move your way up. If, as a teacher, you try to operationalize the development of a competency as a learning progression and then represent that with a ladder, this conveys that students need to be able to do everything on the bottom rung before beginning to move up the ladder. Is that the intention? I’m not sure.
This is likely an effective strategy for some things, but we should be careful not to over apply it. I have concerns about its application to social studies. If the grade 6 students that I researched had needed to demonstrate an accurate understanding of all relevant content information related to the task before they could be invited to think creatively and critically about the future of their city, I don’t think most of those kids would have ever managed to get there, even if they had important ideas that should be shared with the adults making decisions at City Hall. Authentic learning and authentic assessment call on us to invite all of our students into important and challenging thinking from the start, and to use content scaffolding to ensure they have access to information they will need, and procedural and strategic scaffolding (from these organizers and by other means) to prompt the type of thinking that is required for the context.
What’s a favourite visual / graphic organizer that you use? I’d love to see it.
“I’d love to ___________, but my students are too ____________________ “
Did you finish my sentence for me? If so, what popped to mind?
I hear some version of this sentence once in awhile, from both practicing teachers and my students preparing for practicum. The “but my students are too…..” blank is filled with all kinds of things.
Too young
Too “low”
Too apathetic
Too marks-oriented
Too disengaged
Once someone followed up their statement with “that strategy may have worked for you at that school, but it wouldn’t work here.
I get the feelings that underlie those statements, having experienced some of them. I once briefly considered not doing an annual model parliament when I worried that some of the students in one of my blocks would be too rowdy. (In the end, that simulation was just what some of those students needed to be authentically engaged in our learning.)
My reaction was coming from a place of middle-of-the-night stress, but I think in other cases it comes from a better place. Perhaps an assumption that there are other things our students need from us before they would be capable of being offered a learning opportunity that is challenging – real-world – authentic – requiring critical thinking. (See article by Roland Case on this)
As we all start a new year, I would like to share two of the many studies that help remind me of the magic that can happen when we begin by assuming that our students are capable of great things, then help them get there.
Capability of children to deliberate on real-world issues
My dissertation research involved having grades 6 and 7 students make submissions to the Reimagine Nanaimo city planning process while their teachers and I worked on trying to design an assessment of the associated competencies. I was curious about the capability of younger students to participate as citizens in a real-world process. I suspected that with the right support and scaffolding, that they were more capable than we might assume, and found this confirmed in my findings (to be discussed in another blog or article).
In reviewing the literature, I was quite taken with a study conducted by Dr. Jennifer Hauver. Her purpose was “to identify the analytic frames children (ages 9 to 11) employed as they worked together to make sense of an ill-structured problem, what those same children did when their frames collided in the context of deliberative dialogue, and what they learned from the process of negotiation” (Hauver, 2017, abstract).
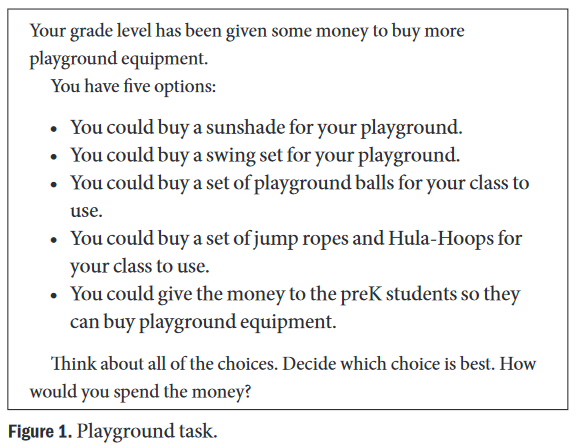
The setting was a 4th grade class at an elementary school somewhere in the American South East. The school’s PTA was considering 5 options to fund finishing the playground at the new school building. These 5 options were shared with the 4th graders, who were put into small groups, with each group engaged in deliberation on which option to recommend to the PTA. Students grappled with a real-world problem that had authentic importance to them, and knew that they would be sharing their results with an authentic audience. Results of the deliberations were shared with the PTA, raising the stakes of the deliberations well beyond a normal classroom conversation.
OK. Have a read over the options that the students were given. What do you think the students would have decided to prioritize for the playground?
If you’d be inclined to fill the blank in my opening sentence with a word like “young” or “self-centered” or “immature”, maybe you’d think “ah – they are just kids. They are going to pick whatever is most fun for their class to use.”
BUZZ – WRONG – TRY AGAIN!
This is not what happened at all.
In analyzing transcripts from the deliberations, Hauver identified common analytic frames visible in the deliberations. They were heavily weighted to considering fairness and the common good, to the point that Hauver named those as “super-ordinate frames, which resonated with peers and facilitated the building of consensus” (abstract). Self-interest as a frame was far, far less common. If a student did propose something that would only benefit their class, other students failed to pick up on those suggestions, and turned the discussion back to making arguments related fairness and the common good.
In responding to this study, Serriere (2017) wrote that researchers have to reject assumptions that young people are incapable of understanding perspectives of others at a young age. She drew on her own research when she wrote:
Like Hauver’s work here on fourth graders who rejected self-centered rationales, we found evidence of kindergarteners eager and willing to investigate multiple perspectives on an ethical dilemma at hand. Thus, it is important that we as scholars and teachers critique egocentricism as a necessary part of childhood or a linear development. (p.3)
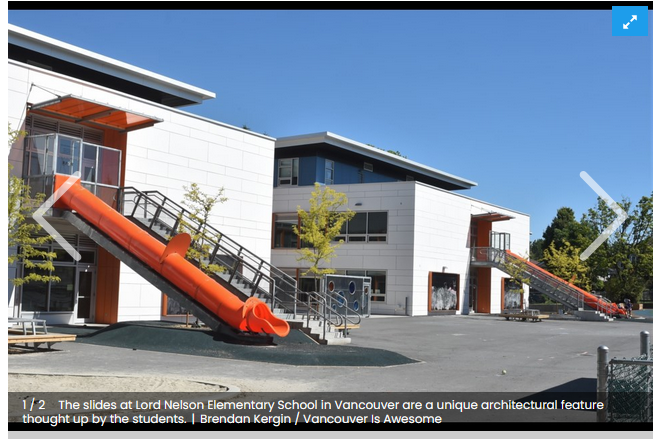
Now doesn’t it just make sense that these students were consulted on an issue like this that would have more authentic importance to them than it would to the adults? But how often do we actually ask those students and act on what they share with us? Here’s a Vancouver example of the magic that can happen when we do:
If we begin by assuming capability in our young students, we give ourselves permission to engage them in challenging, hopeful discussions about the world as they are experiencing it.
By doing so with appropriate scaffolding, we contribute to building the competencies students need, and feel they need, to be our partners in these conversations.
Our planning can then shift to deciding how to frame issues in a way that meets the students where they are, and how best to offer appropriate scaffolding.
“We are Artists”
I spent two weeks in Kelowna this summer, teaching a course for UBCO’s Summer Institute of Education. I found myself thinking often of my friend Sara, and wishing I would have been able to visit her. Sara lived in Kelowna, but died earlier this year from ALS.
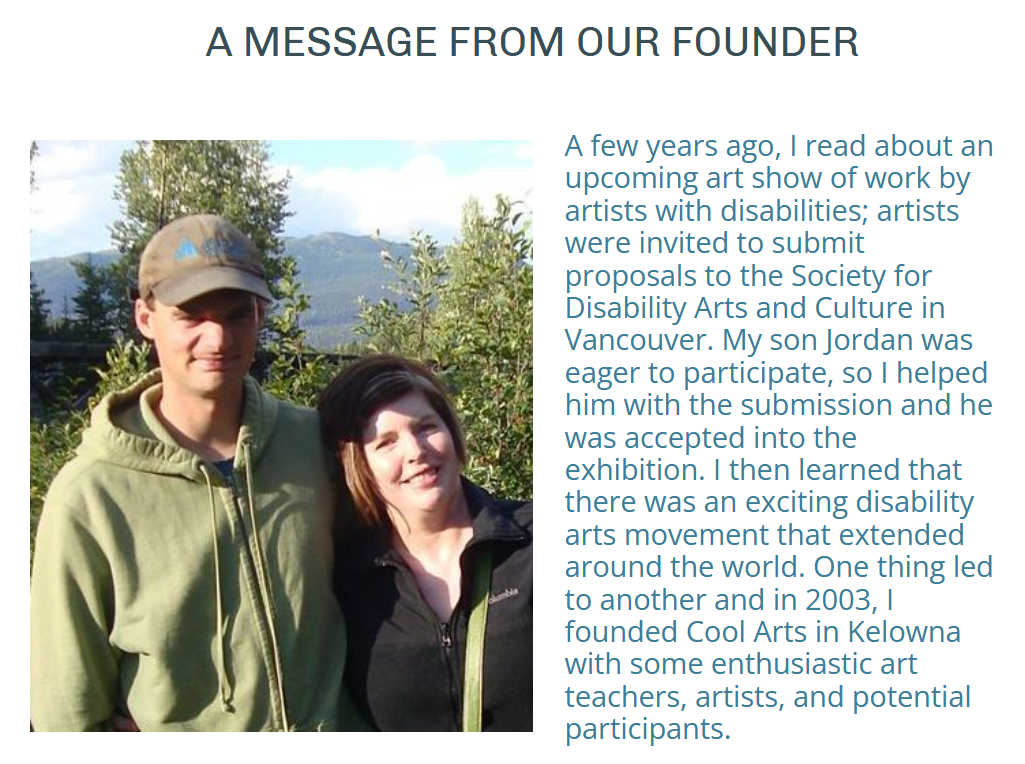
Sara McDonald (formerly Lige) was a talented studio artist and art teacher, a mother and a grandmother, and worked for years at the UBCO campus where I was teaching each morning. Sara was also a formidable advocate and organizer, most recently for ALS funding and awareness, but also for many years in creating an inclusive space in the art world for adults with developmental disabilities. She founded Kelowna’s Cool Arts Society in 2003.
The opening paragraph to Sara’s message on the Cool Arts website
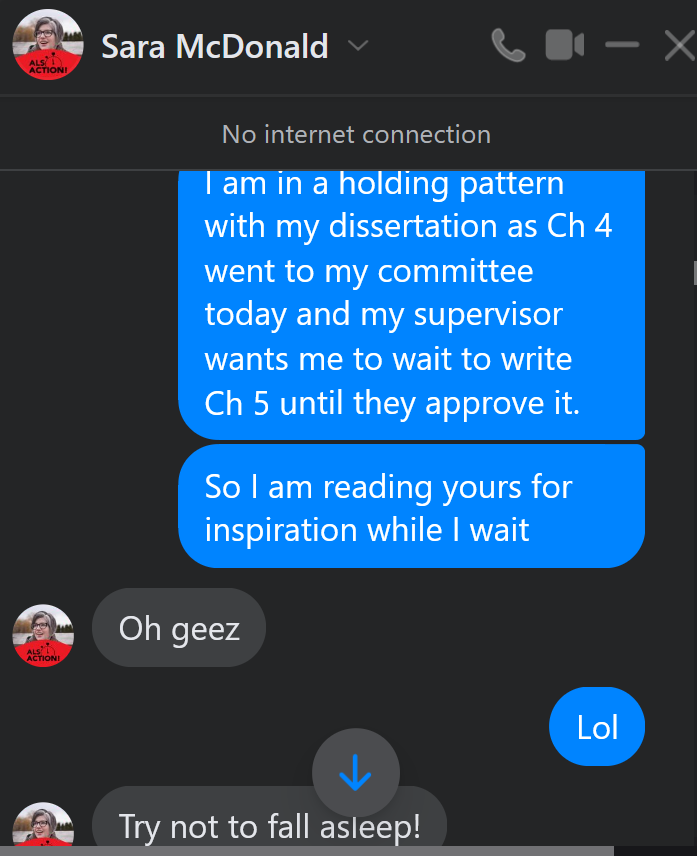
In May 2021, I was following my doctoral supervisor’s advice to read theses and dissertations on many topics to see how the authors had structured their analysis chapters. After my daughter went to bed one night, I downloaded Sara’s thesis Adults with Intellectual Disabilities and the Visual Arts: “It’s NOT Art Therapy!from her MA in Interdisciplinary Studies at UBCO. Several pages in, I messaged Sara to let her know.
I sure didn’t fall asleep! I stayed up too late that night, fully drawn in. I had promised Sara I would skim parts and read only her findings and analysis carefully, but it was too interesting.
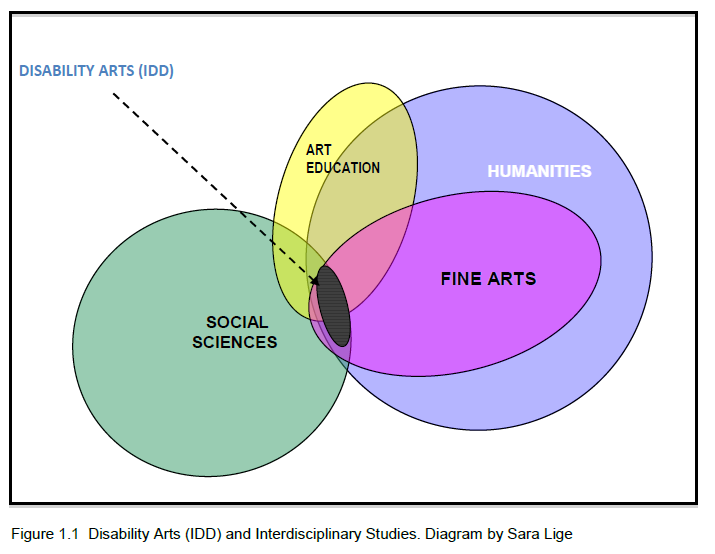
Sara created this diagram to show where her study connected to different fields. She had to cover a lot of ground to show these connections.
As I read, Sara and I wrote back and forth about what I was reading and how I was now reading it with my teacher-educator hat on. I was not her anticipated audience for this work, but it resonated deeply for me in how we think about capability. Sara recommended that I have a close read of the section of her lit review on Tobin Siebers’ research about fabric artist Judith Scott, who lived with Down’s Syndrome.
Sara wrote about Siebers (p. 52):
Siebers identifies as a long-held belief the notion that art is conventionally understood to be produced by ‘genius’, a term that can also be understood as an intelligence capacious enough to carry out works of art, or to use another term, ‘intention’. If art is to be made sense of in this way, then persons with an impaired intelligence cannot create art or are greatly limited in doing so. Siebers takes issue with this premise and asserts that an artist with IDD who produces artwork that is considered to be of a high standard challenges this notion and represents “an absolute rupture between mental disability and the work of art and applies more critical pressure on intention as a standard for identifying artists” (69).
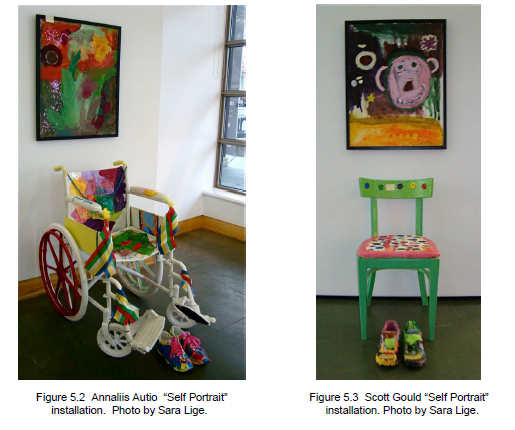
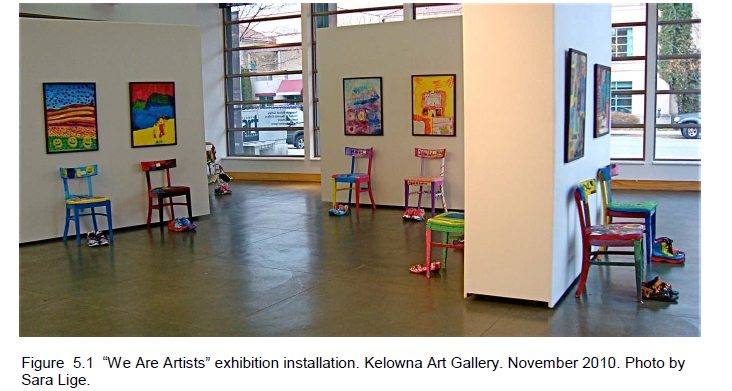
Sara curated the first Cool Arts exhibition at the Kelowna Art Gallery, and I find it exceptionally fitting that it was called “We Are Artists”. The exhibition featured self portraits, each accompanied by chairs and shoes with which Cool Arts artists represented themselves.
In the weeks leading to the opening of the exhibition, Sara began collecting data for her case study of Cool Arts artists. Her research question was “what is the experience of artists living with IDD in the context of their art-making practice, and how does this experience act to help establish that artists with IDD can have an authentic art-making practice?”
Three artists from Cool Arts consented to participate in this study. Sara filmed an art making session with each artist. In follow-up individual interviews, she and each artist watched the video of their art making session. Sara used each video as a prompt to ask the artists questions about their decision-making, to guide them to reflecting on their process.
Sara found that each participant was working in ways that are associated with being an “artist”, such as:
Demonstrating an understanding of materials and technique
Exhibiting individual styles
Engaging in choice-making
Sustaining focus and concentration
Seeing and describing themselves as artist
There are lessons teachers can draw on from this research and from the ongoing work of the Cool Arts Society, where the staff and guest instructors begin with an assumption of capability every day. If I have piqued your interest, I hope that you will download Sara’s thesis here or check out this podcast interview of Sara by her daughter, Rachel. Then start a conversation with your colleagues about how this can inform our impressions of capability. And inclusion.
Have a wonderful start to the school year, and try to begin it also with a sense of your own capability to do the sort of work that you would love to do this year with your students!
Note: I have focused narrowly on the value of starting with an assumption of capability, but I could have easily written this blog post about assessment of capability or competency. The capability of the artists became visible in observing it in action. Sara applied evidence from her observations and conversations and examination of the artists’ work to criteria that she had assembled from real-world application. This blog is too long as it is, so I will save assessment for another day.
So what do you think? Please share your comments about my call for an assumption of capability. What are your experiences?
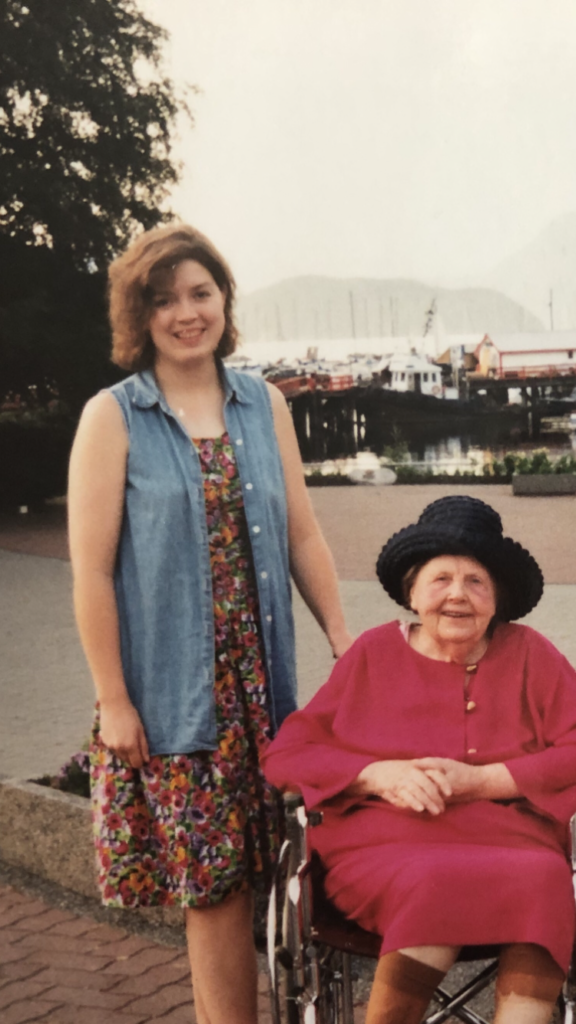
With my Finnish Mummu in one of my favourite teacher outfits, 1995
“Hey Miss Poikonen… what’s nationalism again?”
“Matt”, History 12 student, Sentinel School, June 1995.
My first year of full-time teaching began without warning – as is common – when a call to TOC became a full year leave replacement. I was a 24-year-old with a perm and “bright colours and vests” teacher look, teaching History 12. I needed to know enough about world history in the 20th century that I could adequately prepare students for a provincial exam worth 40% of their mark. I had never taken a course on the Middle East. Or China. Or Stalin. But somehow, I knew a LOT about praetorianism in South Asian politics, nuclear deterrence, and asymmetrical warfare (Finnish Winter War, thanks to family lore) so I allowed myself some tangents.
My students were under pressure to do well on that exam, to secure and hold those seats in university programs. Even the self-proclaimed class clown had applied to, and would attend, a circus university in the US. I gratefully accepted resources and ongoing advice that year from Steve May, the exceptional teacher I had stepped in for. I spent the year working my way through his binders, using his overhead notes, student-led seminars, debates, and research assignments. At the end of each unit, I unlocked the filing cabinet to find the numbered copies of multiple choice / definitions / essay exams, then returned them to the filing cabinet again after the students used them.
Late June: the morning of the provincial exam had arrived.
Students were dropping off their textbooks and picking up peppermints from me to have at their tables in the gym. Maybe they were ready! Maybe it was going to be OK, and they would get into university, and no parents would come shout at me or sue me (that actually happened to a colleague at the school – the judge threw out the case) and I would get another contract for next year! These students were a joy. I wished them well and sensed – correctly – that as my first group, I would remember their faces even after teaching thousands more students.
A few minutes before the exam, “Matt” burst through the door, looking – a little scattered. He was a tall kid with a mass of blonde curls and flushed cheeks, perpetually almost late but not actually late, and always with a smile for everybody. Virtually every mark I gave him all year was 80%. Tests. Homework. Essays. I didn’t really know what I was doing with assessment, but he was so consistent, and appeared to agree with me that 80% was accurate and fair.
“Hey Miss Poikonen… what’s nationalism again?”
Nationalism was a major theme in the curriculum.
Many past provincials had essay questions about it.
We had compared the definition to related terms.
They had applied it to case studies and debated its impact.
They had all made exam prep notes about course themes, including nationalism.
Matt had even attended an optional Saturday exam prep session and had participated in scribbling ideas and timelines on the board for the themes, including this one.
How could he not remember what this concept was? I had failed him! What was the point of any of this work that we had done if Matt, at 80%, needed to ask me what nationalism was?
Maybe I was not cut out for this!
I have no memory of what Matt got on that provincial. He probably did fine, and like the others, went on into more schooling and work and life, and doesn’t remember either. He probably can’t quite come up with my name anymore, just as I can see his face but can’t quite come up with his.
I related this story to Megan, a teacher I met with a couple of weeks ago. She was ending the year concerned her students were not adequately grasping some of the many key concepts in her grade 11 program. I recommended that she look for ideas in the chapter on teaching concepts by John Myers & Roland Case in the anthology that I assign to my secondary Socials Methods students. The chapter provides quite a comprehensive discussion of teaching for conceptual understanding, with many suggested activities.
Roland writes about a conversation with his niece, then in grade 9. Learning she had just scored 96% on a unit quiz on political and economic concepts, Roland asked her a question that would require her to apply capitalism to Canada. He learned that despite her accurate definition, she was unable to apply that definition to real-world examples. She didn’t appear to have much conceptual understanding of capitalism – just that memorized definition.
So. What would that anecdote have me to think about Matt’s conceptual understanding of nationalism? Matt was asking for a definition of this term, so did he go off into the world with less understanding of nationalism than Roland’s niece had of capitalism?
Nope. I don’t think so. 27 years later after Matt’s provincial, I have forgiven myself!
Thanks to the advice and the binders of a master teacher, I did some explicit work that year in exploring the nature of nationalism as a concept. We did a lot more than memorize terms. I suspect that Matt would have been able to draw on some transferable conceptual understanding of nationalism, when, a few months later, he watched the results come in from the Quebec sovereignty referendum, or this year, when he may have seen posts about Ukrainian resistance to Russia’s invasion in his social media feed. Maybe he has never had the occasion to say the word nationalism in all these years, but I hope that somewhere, the shape of this concept informs how he greets relevant new information.
Knowing the sort of explicit work on building conceptual understanding that Megan is doing, I suspect her students were also leaving her class with more conceptual understanding than she could measure with her assessments.
Here is why I think so:
Bransford and Schwartz (1999) reviewed literature on “transfer”, noting how disheartening many studies would appear to educators. The studies they reviewed showed more failures than successes. Students appeared to be struggling to transfer learning from one context to another. But then the authors asked if it could be that the way we tend measure transfer is “too blunt of an instrument” to pick up on it happening so gradually?
A striking feature of the research studies just noted is that they all use a final transfer task that involves what we call “sequestered problem solving” (SPS). Just as juries are often sequestered in order to protect them from possible exposure to contaminating information, subjects in experiments are sequestered during tests of transfer. There are no opportunities for them to demonstrate their abilities to learn to solve new problems by seeking help from other resources such as texts or colleagues or by trying things out, receiving feedback, and getting opportunities to revise. (Bransford & Schwartz, 1999, p. 68)
Bransford and Schwartz proposed an alternative way of looking at transfer, in considering what students learn as “preparation for future learning” (PFL). They cited the work of Broudy (1977) who wrote that in looking for transfer, we tend of focus only on replicative knowledge (“knowing that” – or in our case, knowing the textbook definition of nationalism) and applicative knowledge (“knowing how”). Broudy argued that we also “know with” our previously acquired concepts and experiences; that an educated person “thinks, perceives and judges with everything that he has studied in school, even though he cannot recall these learnings on demand” (p. 77)
Knowing with may be comparable to tacit understanding that people with some degree of expertise have with what they do regularly, even if they can’t pinpoint how this understanding developed over time or operationalize how to explain it. If you are an experienced teacher and have ever supervised a pre-service teacher on practicum, you likely have run into this. Perhaps over the years you have developed a tacit understanding of how to build community in your class but must pause to think about what that entails, so you can explain it to a novice.
The upshot (?)
I hope any of you who read this are starting a well-deserved summer with confidence that the conceptual understandings, dispositions, and competencies your students will be “knowing with” in the future were influenced by the work you did together this year.
Our work in BC on competencies and with proficiency scales has made us all more accustomed to thinking about learning as complex growth on a long continuum, over years. Designing assessments to adequately give us glimpses of that growth is a challenge that teachers across the provinces are rising to. I sense “knowing with” and “preparation for future learning” are ideas, older than our curriculum, that support our intentions.
That’s not to say these ideas make anything easier in practice. While wonderful to imagine contributing to something that may consolidate years later in a student, what are the practical implications for teachers work with students now, in planning for learning, and assessment? What do you think?
One recommendation by Bransford and Schwartz is to design opportunities for authentic inquiry. Something that will have value to students beyond getting an assignment done for class. The focus of most future posts in this blog will be on situating learning and assessment in real-world places, problems, and processes, should you like to come back to have a look again. I will also return to the topic of teaching for conceptual understanding with some links to activities.
Have a great summer!
PS – The glimpses I just provided of the work of Broudy, and of Branford & Schwartz, and the studies they reviewed are inadequate! They say a lot more that is very interesting and useful. If you are interested, I recommend reading further:
Bransford, J. D., & Schwartz, D. L. (1999). Chapter 3: Rethinking transfer: A simple proposal with multiple implications. In A. Iran-Nejad & P. D. Pearson (Eds.), Review of research in education, 24 (pp. 61–101). American Educational Research Association. https://doi.org/10.3102/0091732X024001061
The Canadian Historical Association recently invited me to write a blog about an assignment I had my Social Studies Methods students do this fall. As we couldn’t do place-based field trips, perhaps the videos would allow each of us to invite everyone else along on field trips to sites in our communities where we can build historical and geographic thinking competencies. Read the blog here.
While a number of my students generously offered to make their videos available, I could only fit references to about half of them in the blog. Here is a full list. I hope to add more soon if I receive more waivers from students:
I filmed a couple of exemplar videos to provide to the students. In doing so, I realized just how hard it was to remember to say everything I had intended and not run way over time. The first video has me at Diana Krall Plaza imagining a field trip to discuss urban planning with grade 6 or Urban Studies 12.
I also brought two curious grade 4 students along to look at a mysterious relic along the Nanaimo River. What could it be? What evidence can we find to support one of the theories that I have been told? All in all a fun activity, but we left some of their more fantastical theories out of the video so they don’t later regret the existence of this video.
Mysterious relic to investigate in the Nanaimo River Estuary
Check out the video that a group of our students filmed on our 2019 trip. Their commentary on the nature of our work over the three days is really interesting.
Teresa Farrell and I share a large office at VIU with our colleagues Mary Ann and Deirdre. I hope nobody ever offers me a chance to have an office to myself, as room 270 is a place where some pretty cool ideas percolate and take shape. This fall, as we teach our classes online, I miss that time with my colleagues in 270, and I miss taking our teacher education students on field trips that we hope will build what Bereiter (2014) calls principled practical knowledge (or the know how + know why) of place-based education.
Our colleagues at the VIU Faculty of Education have been doing place-based and land-based education in many ways since before I joined the faculty in 2016. My first introduction to my colleagues and some future students came in the fall of 2015, when I tagged along with my small daughter for an interdisciplinary place-based field trip to Neck Point Park in Nanaimo. It was blustery day and my 3 year-old I weren’t dressed warmly enough, but we watched – transfixed – as Teresa pulled local history and performing arts together into an activity that had students and my daughter acting as fish and nets on a bluff overlooking Shack Island. I was happy to get involved in that annual day in subsequent years, when we situated the work in downtown Nanaimo and invited our students to see that place with their heritage, urban planning, sociologist, scientist, and artist hats on.
Our two most ambitious trips so far had us take large groups of students to the Fraser Canyon in 2018 and 2019. This Canyon is one of Teresa’s favourite places in the province. It was a place I hardly remembered from childhood until my old university friend Mike McDonald – famous (infamous?) among anyone who knows him as an epic Fraser Canyon enthusiast – began inviting me on what I call history nerd junkets to the region. He had been involved in the establishment of the New Pathways to Gold Society, which ” supports economic development through heritage tourism, First Nations reconciliation, community projects and heritage events in the historic Hope-Bakerville/Gold Rush Trails Corridor of British Columbia.” I came home from a NPTGS trip* with Mike, historian Dr. Daniel Marshall, and others to Lytton in April 2018, and rushed into 270 on a Monday morning to tell Teresa all about it. Within minutes we had decided that we needed to take our students to experience this incomparable place – a place where geography and history intersect in so many dramatic ways that place is “in your face”. Dan Marshall helped us to design our first itinerary, the New Pathways to Gold Society and our faculty provided base trip funding, and so in September that year we found ourselves on an early morning ferry with 35 students and a rich itinerary for three days.
We are launching this blog to share the work we have been doing in place-based education over the last couple of years and continue to try to do in our online courses. We will be sharing assignments, the work of some of our students, videos and images of our field trips, and our publications. Look for future posts sharing more about the 2018 and 2019 trips and a soon-to-be published paper about our research findings from the 2019 trip.
We will also invite colleagues, alumni and students to share their place-based education work. Please reach out with any questions, comments, or ideas for our future trip.
Paula Waatainen
*Read about that powerful April 2018 trip in the Vancouver Sun