In the Beginning
The Centre for Innovation and Excellence in Learning (the Centre) was a very different place in 2013. During Fall semester, some faculty members at Vancouver Island University (VIU) had begun using VIULearn (D2L) for the first time. VIUBlogs was starting to get more use from faculty members and learners, and VIUTube had just been installed on campus. This was a time of growth and change for the Centre. It was also the time we began asking ourselves questions like:
How many faculty members need help with VIULearn?
What supports are students requesting?
Which departments want support with specific learning technology tools?
In order to start answering questions like these, and to better understand how to support VIU’s use of educational technology tools, we adopted a request tracking system – Web Help Desk (WHD). This system allowed us to sort and label our incoming requests from a single dashboard that was accessible to all members of the Centre team. We could read and reply to emails, categorize requests, and generate reports to help us start answering our questions about our clients.
Initially we gathered information related to the numbers of requests we received from individuals and departments, what those requests were about, and how much time we spent replying. As the Centre grew, and as requests became more complex, we realized a simple tally of what we were being asked was not enough. We had already noticed, qualitatively, that faculty members were asking more complex questions – but we had no reliable way to discuss this. We had also realized that we were developing data about the educational technology questions, but didn’t have the same data when it came to pedagogy questions.
Changing our Method
Recently we restructured our request tracking system, to ensure that requesting and giving support was easier for VIU and for ourselves. We also wanted to make sure we could report on what we were doing with quantitative data and track the changes in support requests over time.
We see support requested in two main areas across campus – Pedagogy and Technology.
Within area branch are four tiers (or categories) to help organize the unique requests specific to each area. Tier 1 is for questions that can be answered quickly and without the need for in-depth investigations. Tiers 2 and 3 are for questions that require more detail, or need a more significant investment in time to answer. Tier 4 represents larger scale questions like learning technology implementation and institutional projects and initiatives.
Each tier within the Pedagogy or Technology areas is assigned to different staff member in the Centre.
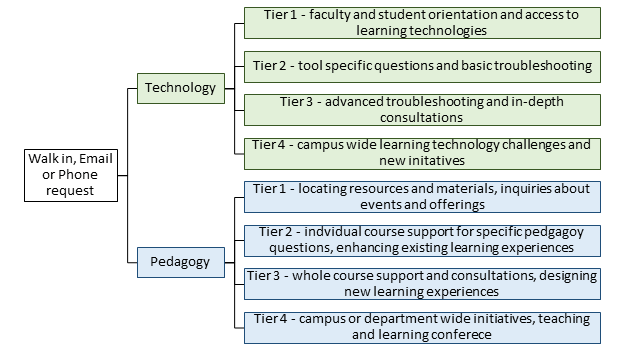
This helps us ensure that questions get to the team member best suited to answer them as quickly as possible. The request tracking system also automatically displays the last five requests an individual has made, so their history is considered when replying to their questions. The Centre team can share information and transfer requests between team members much more easily which leads to better continuity of service for faculty members and learners.
Of course, Web Help Desk also allows the Centre to ask and answer interesting questions, like
Is there enough interest at VIU to run a course redesign institute?
How has the use of VIULearn changed over time?
When do faculty members ask for support, and what can we do during those times to support them better?
We can review detailed data about the number of requests we get on specific subjects (both for technology and pedagogy) month to month, which helps us build a better understanding of VIU’s needs over time. We can track how often certain request are made, letting us see trends and target support resources to them. We can also report on our yearly activities, letting VIU know what we are doing and how we are doing it.
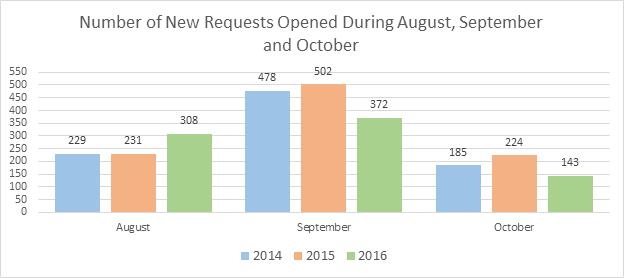 This chart above indicates new requests were increasing in August every year, but have decreased in 2016 for both September and October.
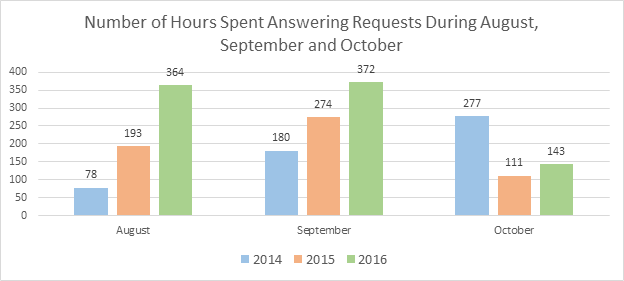 The above chart indicates that despite the number of new requests slightly decreasing, the number of hours needed to answer requests has increased every year since 2014.
Considered together, these two charts give us a lot of information, which we careful investigate and compare against other analytics we have from our learning technology systems. This information tells us that faculty and staff are asking more complex questions, which indicate an increased use of and comfort with learning technologies.
All the information from our request tracking system will be used to ensure the Centre continues to evolve and support VIU in ways that are consistent with VIU’s vision and with the needs of our faculty members and learners.