1914-1918 – Casualty Figures
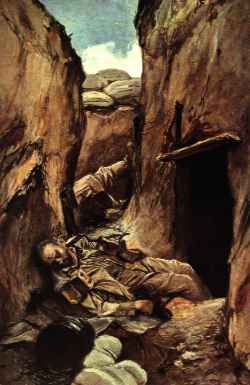 |
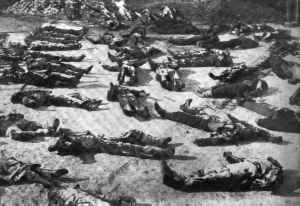
| Dead German troops, Oct-1915 |
| The casualty figures below are presented both in numbers and as a percent of the total forces mobilized. This method allows us to see the severe toll the war took on the smaller countries such as Rumania, where numbers alone don’t convey the loss. These figures are from Susan Everett’s History of World War I (page 248). No two books tend to have the same figures so don’t worry if you see different numbers elsewhere. They are representitive enough for the comparitive purpose intended here.
Note: The Central Powers are titled in red. Click here to download a zip file containing the Microsoft Excel version 5.0 spreadsheet (casualty.zip, 7K) of this data with sample charts. The spreadsheet does not contain macros and is safe to download.
PLEASE READ BEFORE EMAILING ME ON OMISSIONS Please be aware that these figures are taken from the Official History of the war. Allied Dominion figures were not broken out. Thus countries including Australia, Canada, and New Zealand are not listed separately – so I didn’t have the data available for the various statistical groupings offered below. I fully appreciate the contributions made by these nations and in no way am I downplaying the important role they played. Keep in mind that I’m a yank, but you’ll find more information at this site on Australia, Canada, and New Zealand than you will on the US. |
| See also: |
|
Sorted by number Mobilized Mobilized Dead Wounded Missing/PoW Russia 12,000,000 1,700,000 4,950,000 2,500,000 Germany 11,000,000 1,773,700 4,216,058 1,152,800 Great Britain 8,904,467 908,371 2,090,212 191,652 France 8,410,000 1,375,800 4,266,000 537,000 Austria-Hungary 7,800,000 1,200,000 3,620,000 2,200,000 Italy 5,615,000 650,000 947,000 600,000 US 4,355,000 126,000 234,300 4,526 Turkey 2,850,000 325,000 400,000 250,000 Bulgaria 1,200,000 87,500 152,390 27,029 Japan 800,000 300 907 3 Rumania 750,000 335,706 120,000 80,000 Serbia 707,343 45,000 133,148 152,958 Belgium 267,000 13,716 44,686 34,659 Greece 230,000 5,000 21,000 1,000 Portugal 100,000 7,222 13,751 12,318 Montenegro 50,000 3,000 10,000 7,000
Sorted by number dead Mobilized Dead Wounded Missing/PoW Germany 11,000,000 1,773,700 4,216,058 1,152,800 Russia 12,000,000 1,700,000 4,950,000 2,500,000 France 8,410,000 1,375,800 4,266,000 537,000 Austria-Hungary 7,800,000 1,200,000 3,620,000 2,200,000 Great Britain 8,904,467 908,371 2,090,212 191,652 Italy 5,615,000 650,000 947,000 600,000 Rumania 750,000 335,706 120,000 80,000 Turkey 2,850,000 325,000 400,000 250,000 US 4,355,000 126,000 234,300 4,526 Bulgaria 1,200,000 87,500 152,390 27,029 Serbia 707,343 45,000 133,148 152,958 Belgium 267,000 13,716 44,686 34,659 Portugal 100,000 7,222 13,751 12,318 Greece 230,000 5,000 21,000 1,000 Montenegro 50,000 3,000 10,000 7,000 Japan 800,000 300 907 3
Sorted by number wounded Mobilized Dead Wounded Missing/PoW Russia 12,000,000 1,700,000 4,950,000 2,500,000 France 8,410,000 1,375,800 4,266,000 537,000 Germany 11,000,000 1,773,700 4,216,058 1,152,800 Austria-Hungary 7,800,000 1,200,000 3,620,000 2,200,000 Great Britain 8,904,467 908,371 2,090,212 191,652 Italy 5,615,000 650,000 947,000 600,000 Turkey 2,850,000 325,000 400,000 250,000 US 4,355,000 126,000 234,300 4,526 Bulgaria 1,200,000 87,500 152,390 27,029 Serbia 707,343 45,000 133,148 152,958 Rumania 750,000 335,706 120,000 80,000 Belgium 267,000 13,716 44,686 34,659 Greece 230,000 5,000 21,000 1,000 Portugal 100,000 7,222 13,751 12,318 Montenegro 50,000 3,000 10,000 7,000 Japan 800,000 300 907 3
Sorted by number missing/PoW Mobilized Dead Wounded Missing/PoW Russia 12,000,000 1,700,000 4,950,000 2,500,000 Austria-Hungary 7,800,000 1,200,000 3,620,000 2,200,000 Germany 11,000,000 1,773,700 4,216,058 1,152,800 Italy 5,615,000 650,000 947,000 600,000 France 8,410,000 1,375,800 4,266,000 537,000 Turkey 2,850,000 325,000 400,000 250,000 Great Britain 8,904,467 908,371 2,090,212 191,652 Serbia 707,343 45,000 133,148 152,958 Rumania 750,000 335,706 120,000 80,000 Belgium 267,000 13,716 44,686 34,659 Bulgaria 1,200,000 87,500 152,390 27,029 Portugal 100,000 7,222 13,751 12,318 Montenegro 50,000 3,000 10,000 7,000 US 4,355,000 126,000 234,300 4,526 Greece 230,000 5,000 21,000 1,000 Japan 800,000 300 907 3
Sorted by percent dead of total Mobilized Dead % Wounded % Missing/PoW % Rumania 44.76% 16.00% 10.67% France 16.36% 50.73% 6.39% Germany 16.12% 38.33% 10.48% Austria-Hungary 15.38% 46.41% 28.21% Russia 14.17% 41.25% 20.83% Italy 11.58% 16.87% 10.69% Turkey 11.40% 14.04% 8.77% Great Britain 10.20% 23.47% 2.15% Bulgaria 7.29% 12.70% 2.25% Portugal 7.22% 13.75% 12.32% Serbia 6.36% 18.82% 21.62% Montenegro 6.00% 20.00% 14.00% Belgium 5.14% 16.74% 12.98% US 2.89% 5.38% 0.10% Greece 2.17% 9.13% 0.43% Japan 0.04% 0.11% 0.00%
Sorted by percent wounded of total Mobilized Dead % Wounded % Missing/PoW % France 16.36% 50.73% 6.39% Austria-Hungary 15.38% 46.41% 28.21% Russia 14.17% 41.25% 20.83% Germany 16.12% 38.33% 10.48% Great Britain 10.20% 23.47% 2.15% Montenegro 6.00% 20.00% 14.00% Serbia 6.36% 18.82% 21.62% Italy 11.58% 16.87% 10.69% Belgium 5.14% 16.74% 12.98% Rumania 44.76% 16.00% 10.67% Turkey 11.40% 14.04% 8.77% Portugal 7.22% 13.75% 12.32% Bulgaria 7.29% 12.70% 2.25% Greece 2.17% 9.13% 0.43% US 2.89% 5.38% 0.10% Japan 0.04% 0.11% 0.00%
Sorted by percent missing/PoW of total Mobilized Dead % Wounded % Missing/PoW % Austria-Hungary 15.38% 46.41% 28.21% Serbia 6.36% 18.82% 21.62% Russia 14.17% 41.25% 20.83% Montenegro 6.00% 20.00% 14.00% Belgium 5.14% 16.74% 12.98% Portugal 7.22% 13.75% 12.32% Italy 11.58% 16.87% 10.69% Rumania 44.76% 16.00% 10.67% Germany 16.12% 38.33% 10.48% Turkey 11.40% 14.04% 8.77% France 16.36% 50.73% 6.39% Bulgaria 7.29% 12.70% 2.25% Great Britain 10.20% 23.47% 2.15% Greece 2.17% 9.13% 0.43% US 2.89% 5.38% 0.10% Japan 0.04% 0.11% 0.00% These figures from The Two World Wars, Vol I - World War I by Susan Everett Published 1980 by Bison Books Notes: Russia.wounded - Includes 1,450,000 permanently disabled France.wounded - Includes 690,000 permanently disabled Rumania.dead - Excludes 265,000 civilians dead and missing Portugal.wounded - Western front only. Another 6,000 dead in Africa Turkey.wounded - 1,565,000 including invalids and deserters Bulgaria.wounded - Excluding those that died of disease during autumn 1918 retreat |