working with Adobe InDesign
One of my now favorite content creation tools is Adobe InDesign. I think it’s the same for every Adobe tool: either you love it, or you hate it. It really took me a while to figure out how to use it, but now that I’m able to handle it (at least I know the basics) I really like creating layouts and designs with it.
The special thing about InDesign is its number of tools. It has a very clear structure which makes still easy to use. No matter if pictures, fonts or graphics are most important for your style and your layouts, InDesign makes them all possible. And they all work based on the same structures. Thus, once you’re familiar with the basic commands in the program, it’s really easy to figure everything out. Once you understand the underlying patterns, the program gives you every option and possibility to create layouts and designs just how you like it.
Yet, InDesign is not only useful for conventional layouts. It also gives you the possibility to create websites, blogs and even designs for social media. There are templates you can use as well as the program gives you lots of instructions.
Unfortunately, Adobe applications are not free. However, it is worth it if you need the programs more often. Plus, it looks really good on your resume. Especially in today’s digital world, more and more content needs to be designed online. And Adobe InDesign is not only among the top programs, but is the monopoly on this field

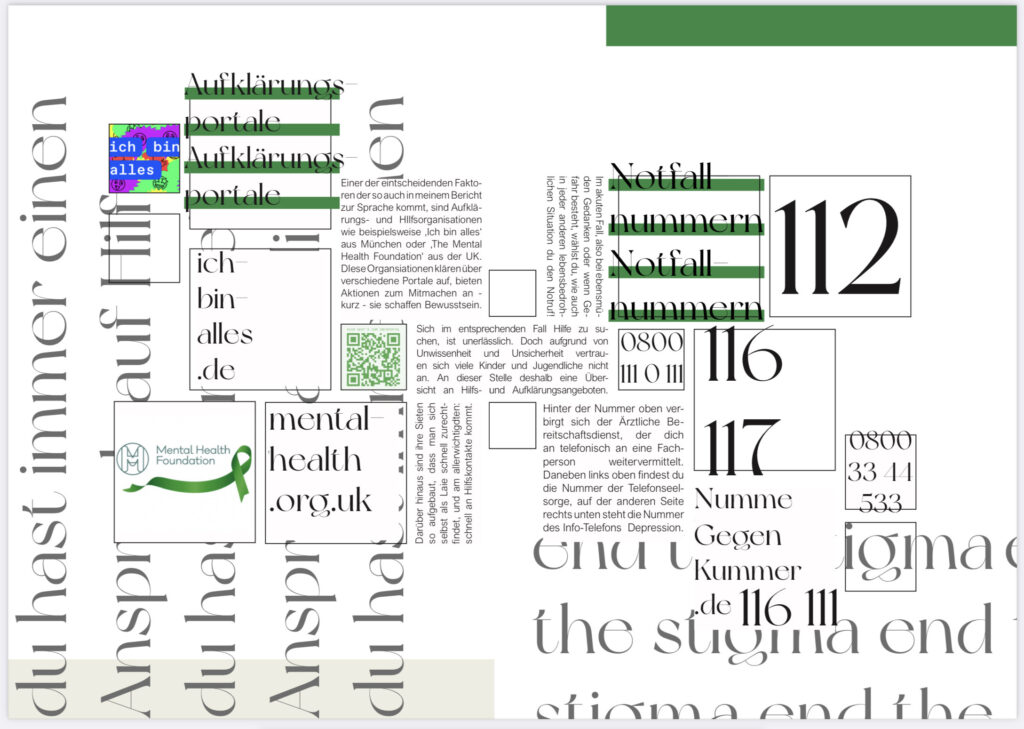
Here you can see an excerpt of a design I did last year for one of my projects at university. Just to give you the information, as it is in German, the magazine article I designed here was about mental health; this page is an overview of contact points and help organizations. In case you are confused, it is a double page.
(I am still very proud of this as I got 100% for it:))
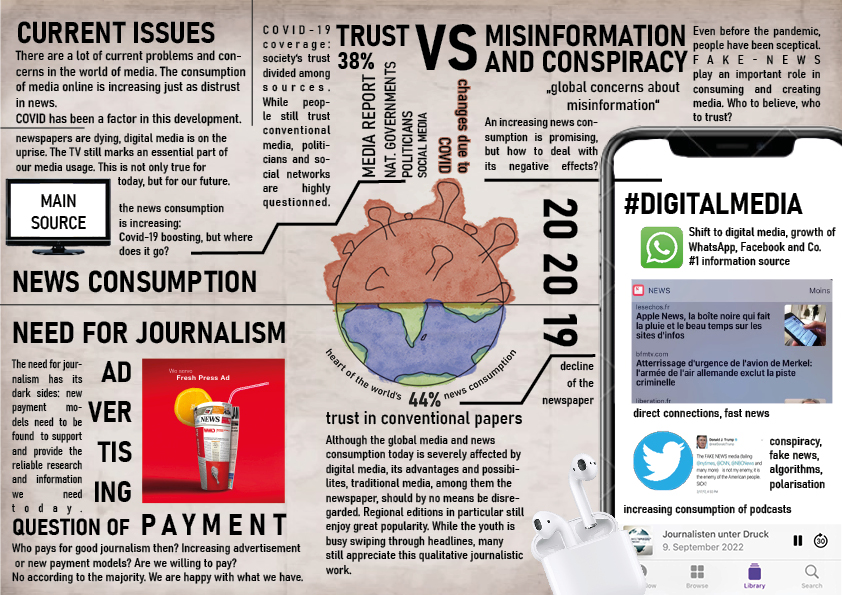
I also worked with Adobe InDesign throughout this course. Most notably, this infographic on the Reuter’s Institute 2020 Report. I can honestly say this graphic took three days to complete, but I’m still happy with it. Also because it gave me the chance to take a deep look into the tool again.

