Thrips
Fungus Gnats
Mealy Bug
Pythium
Phytopthora
Week 35
Below are the heights as record by Team Citrus on August 27, 2020. I used a number of different configurations with the set up of the graphs to test which one displayed the information I want to showcase the best.
Moving forward I will use the configuration shown in below from the 6″ Alpina crop. I used the calendar dates on the x axis and took a screen shot from full view.


New Post
New Post
Measure Poinsettia Heights
Height Tracking Technique
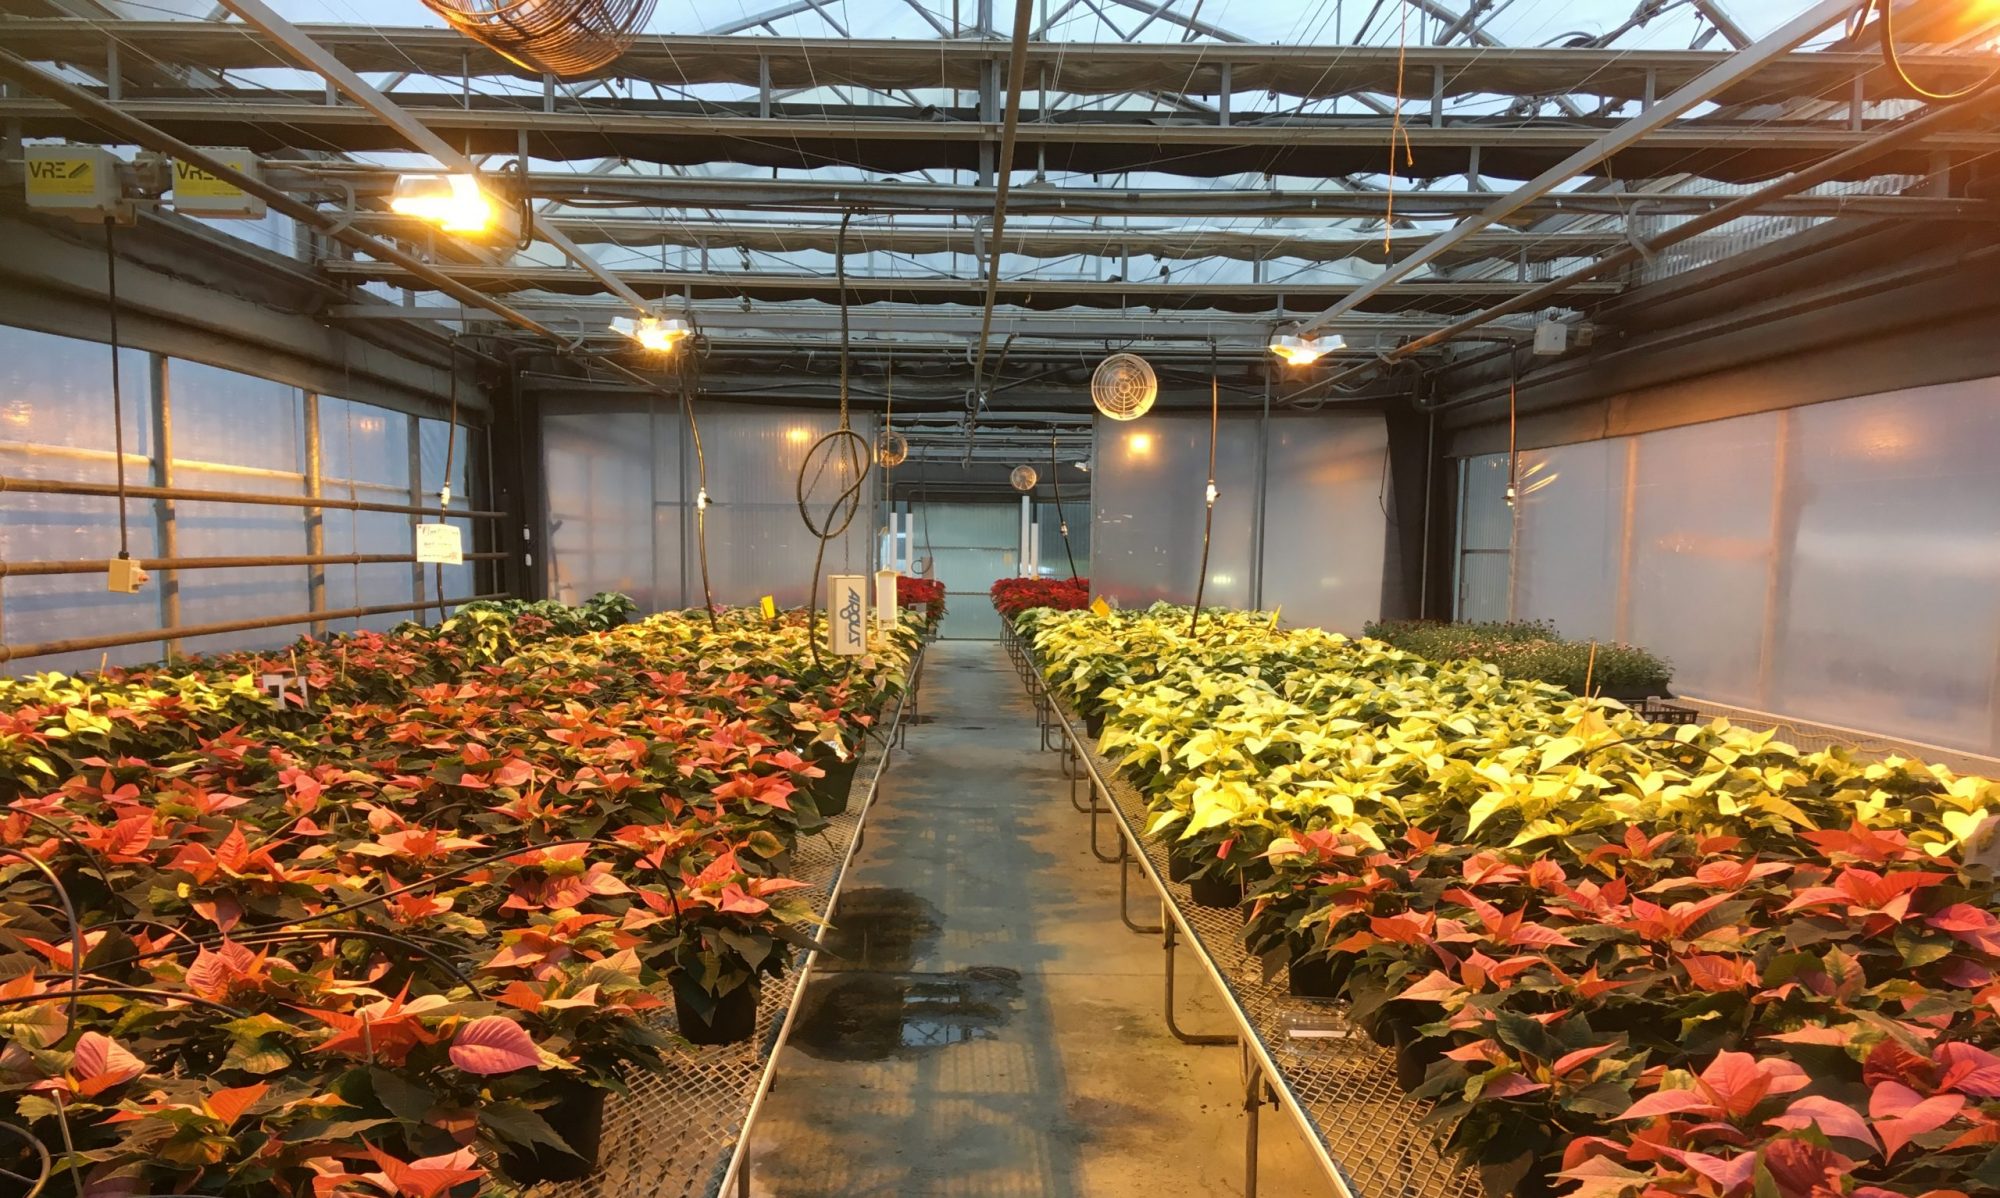
Height tracking system set up by Team Citrus August 27, 2020.
The 4” and 6” poinsettias are both measured and tracked using the same manual measuring method. Students measured the poinsettias, averaged out the heights, and reported them to Christine. Christine recorded them in the graphical tracker and posted them on her blog.
Students should track, measure, and record the same plants every week using these markers:All sample plants had a tall flagging stick with an orange or green flag marked with a number, 1-10.
- All sample plants had a piece of colored tape tied to a bamboo stake and inserted in a plant pot.
- The same plants will be measured each week.
- Students should record the height of their plants every week.
To measure the height of the selected plants, students used a handheld ruler (you can use your gnome ruler for this – gnomes encouraged in pictures) and placed it at the bottom of the pot, at bench level. Then students used a pencil pointed it directly across to the ruler to get an accurate measurement. Students measures to the base of the leaf of the tallest stem, not the tallest leaf, and took the measurement there. Students recorded all measurements in centimetres. Students made sure to place the measurement in the data chart under the same sample number every week.